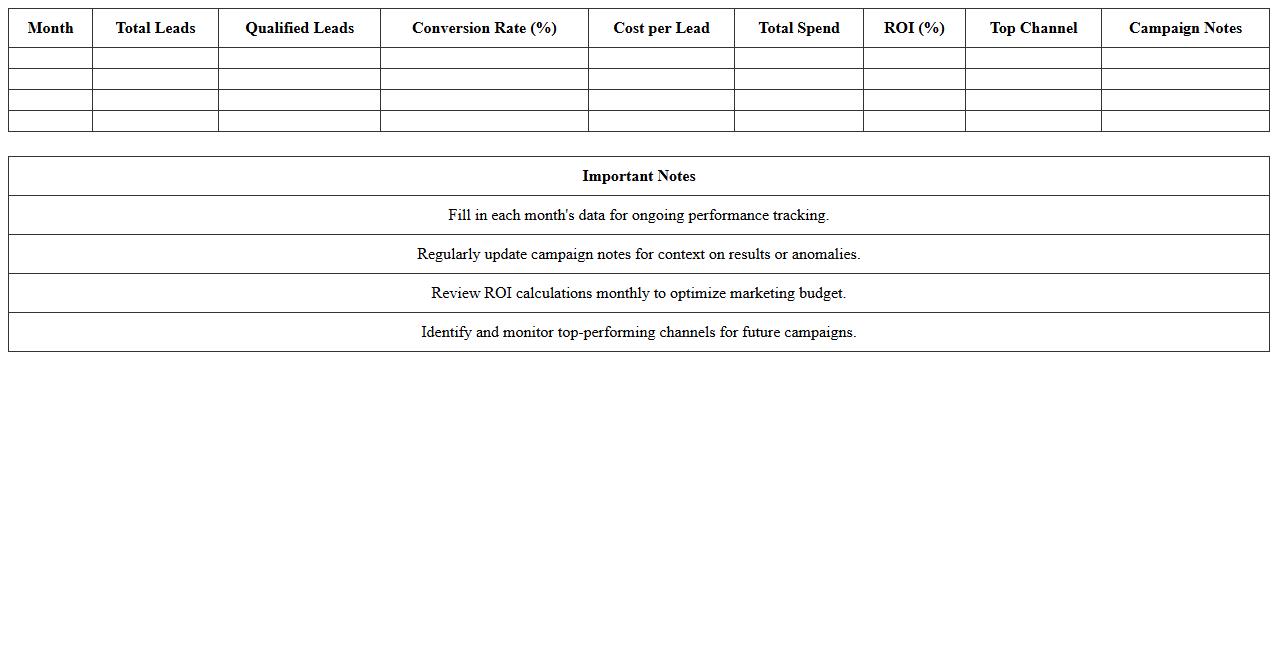
Monthly Marketing Performance Dashboard Excel Template
A
Monthly Marketing Performance Dashboard Excel Template is a structured document designed to track, analyze, and visualize key marketing metrics such as lead generation, conversion rates, campaign ROI, and social media engagement on a monthly basis. It consolidates data into clear graphs and tables, enabling marketing teams to monitor trends, identify successful strategies, and make data-driven decisions quickly. Utilizing this template improves efficiency by automating data calculations and providing a centralized view of marketing performance, enhancing strategic planning and resource allocation.
Digital Campaign Performance Tracker Spreadsheet
The
Digital Campaign Performance Tracker Spreadsheet is a comprehensive tool designed to monitor and analyze the effectiveness of online marketing campaigns by capturing key metrics such as click-through rates, conversion rates, and return on ad spend (ROAS). This document enables marketers to visualize trends, identify successful strategies, and optimize budget allocation for maximum impact. By consolidating data in one place, it streamlines decision-making and enhances campaign ROI through timely performance insights.
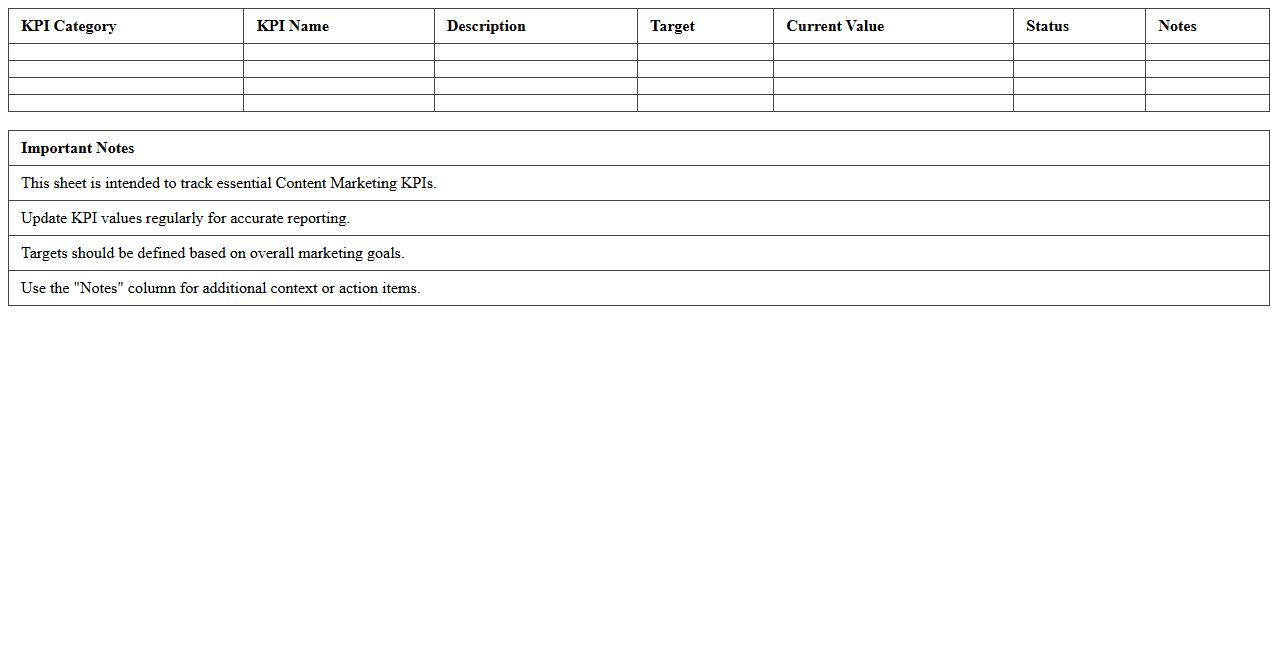
Content Marketing KPI Report Excel Sheet
A
Content Marketing KPI Report Excel Sheet is a detailed document designed to track and analyze key performance indicators related to content marketing efforts. It helps marketers measure metrics such as engagement, conversion rates, and traffic sources to evaluate the success of campaigns. Utilizing this report enhances decision-making by providing clear insights into what content strategies drive results, allowing for data-driven optimization.
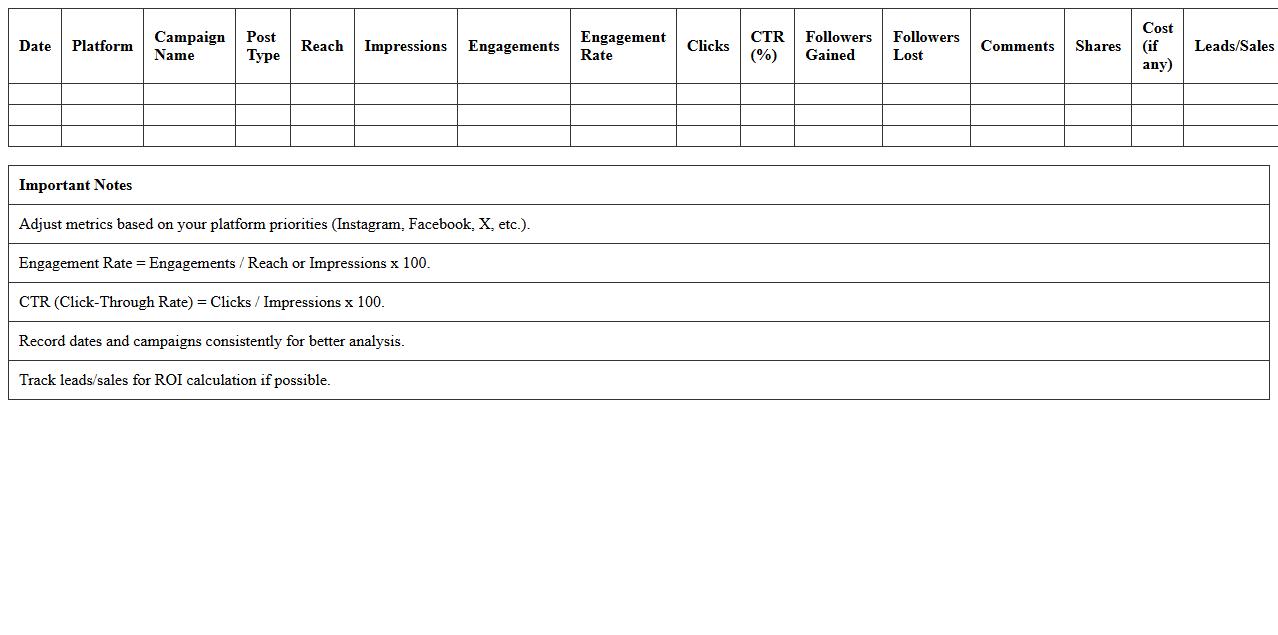
Social Media Marketing Metrics Excel Template
The
Social Media Marketing Metrics Excel Template is a comprehensive tool designed to track, analyze, and visualize key performance indicators (KPIs) from various social media platforms in one organized spreadsheet. It helps marketers measure engagement rates, follower growth, click-through rates, and conversion data to optimize campaigns effectively. Using this template streamlines reporting processes, allows data-driven decision-making, and enhances the ability to demonstrate social media ROI to stakeholders.
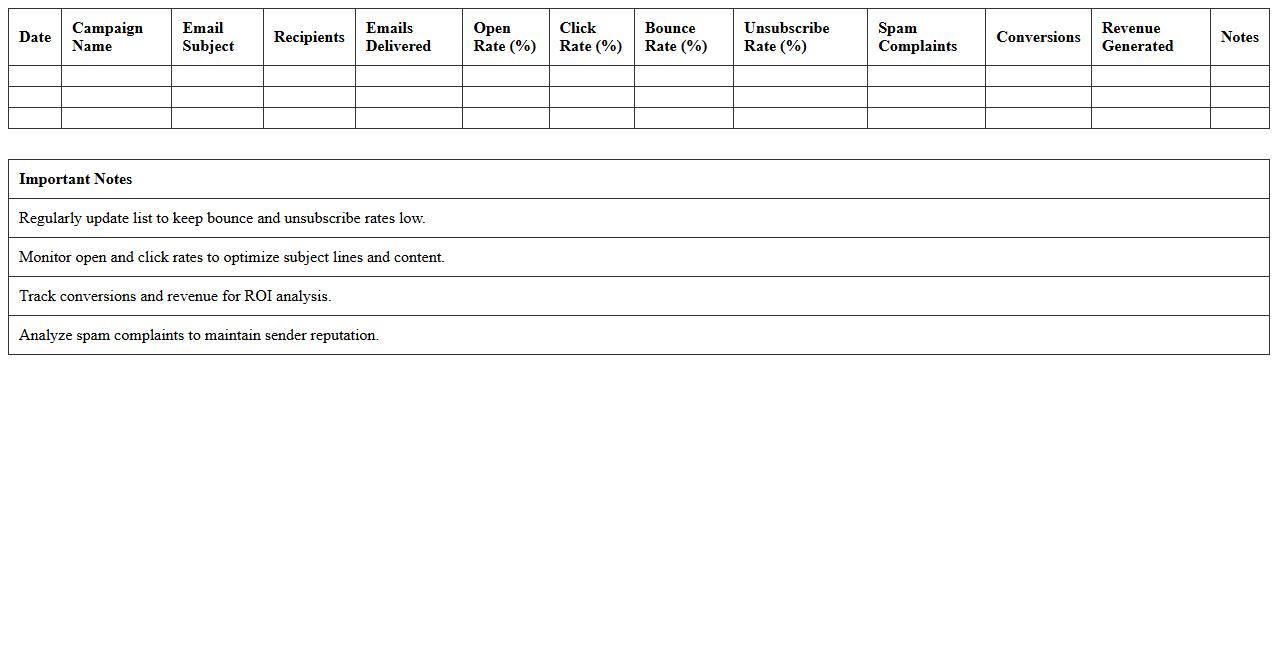
Email Marketing Analytics Report Spreadsheet
An
Email Marketing Analytics Report Spreadsheet is a detailed document that tracks key performance metrics such as open rates, click-through rates, conversion rates, and subscriber engagement for email campaigns. This tool allows marketers to analyze campaign effectiveness, identify trends, and optimize strategies based on data-driven insights. By consolidating email marketing data into an organized format, it enhances decision-making, improves campaign ROI, and supports targeted audience segmentation.
Multi-Channel Marketing ROI Analysis Excel Template
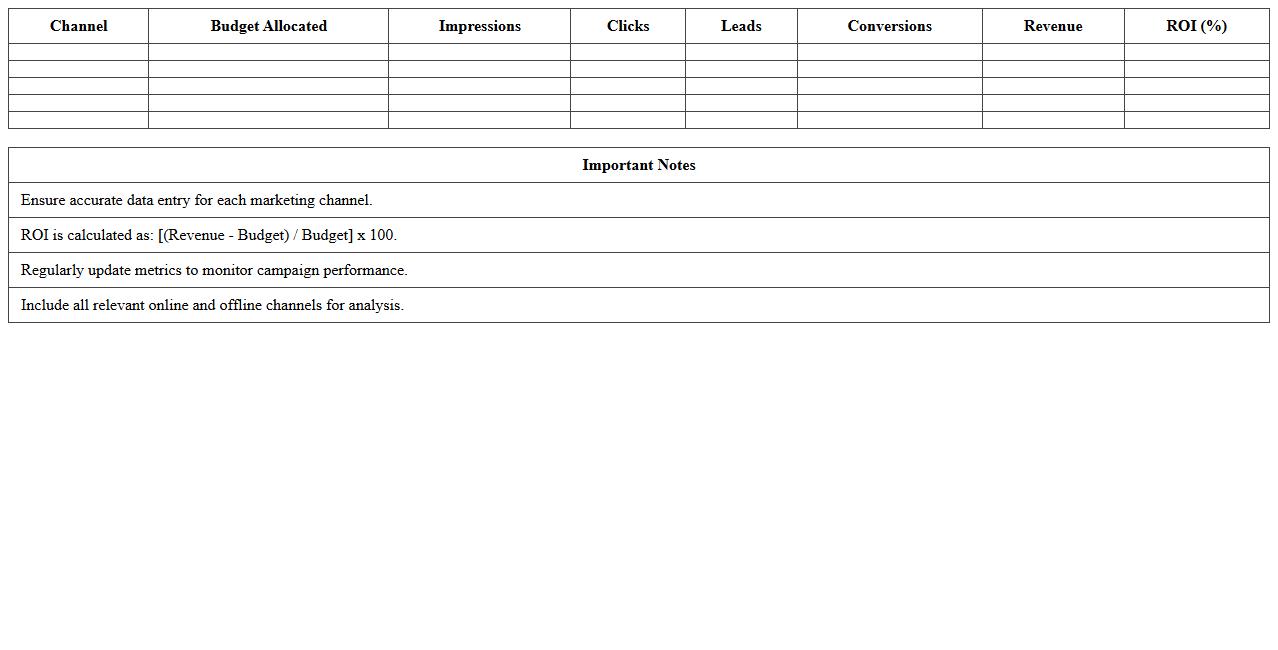
The
Multi-Channel Marketing ROI Analysis Excel Template is a comprehensive tool designed to track and evaluate the return on investment across various marketing channels such as social media, email, PPC, and SEO. It consolidates data inputs and automates key calculations to provide clear insights into the effectiveness and profitability of each channel. This template enables marketers and businesses to allocate budgets more efficiently, optimize campaign strategies, and improve overall marketing performance.
Lead Generation Excel Dashboard for Marketing Teams
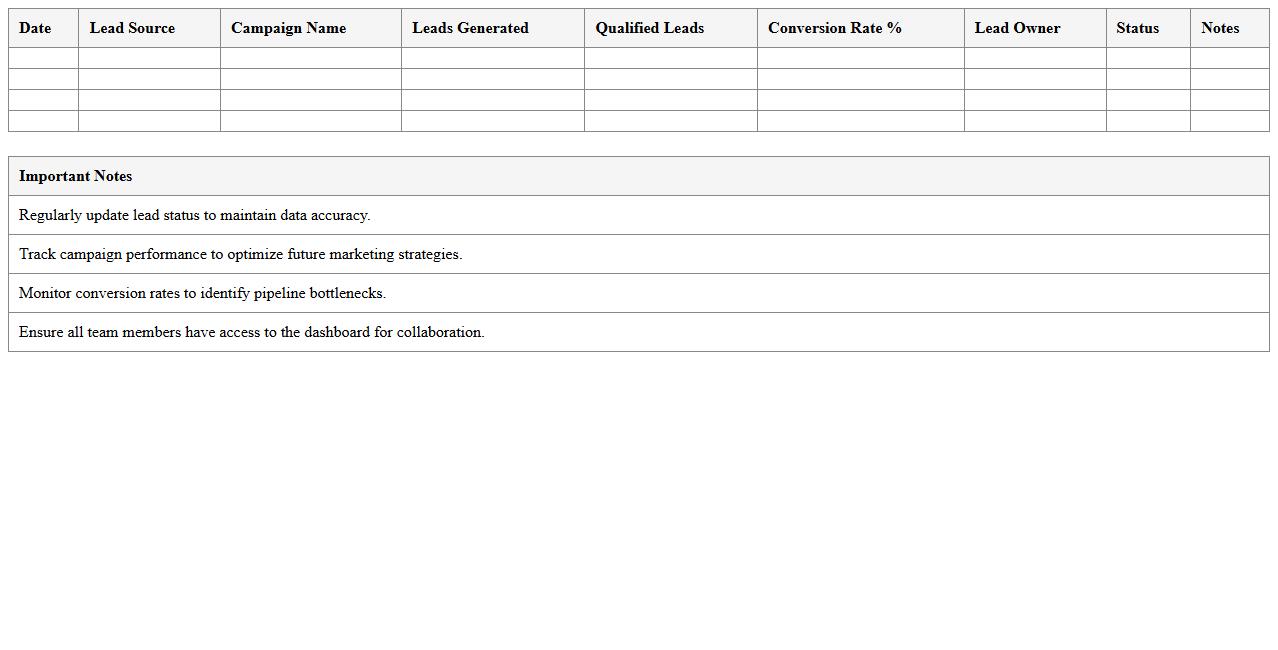
The
Lead Generation Excel Dashboard for Marketing Teams is a comprehensive tool designed to track, analyze, and visualize key lead generation metrics in real-time. It consolidates data from various marketing channels, enabling teams to monitor campaign performance, identify high-converting sources, and optimize lead nurturing strategies. This dashboard enhances decision-making efficiency by providing actionable insights that drive targeted marketing efforts and improve overall lead quality.
SEO Performance Report Excel Worksheet
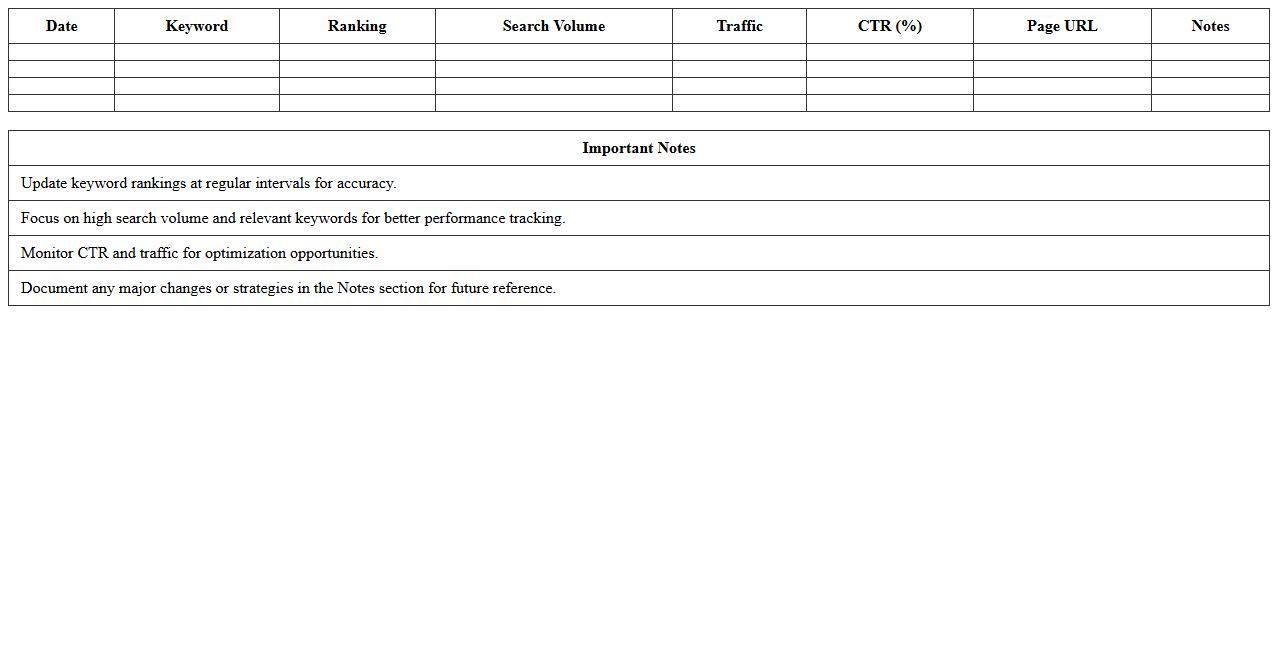
The
SEO Performance Report Excel Worksheet is a comprehensive document designed to track key search engine optimization metrics such as keyword rankings, organic traffic, click-through rates, and backlink quality. This worksheet enables marketers and SEO specialists to analyze trends, identify areas for improvement, and measure the effectiveness of their SEO strategies over time. By consolidating critical data into an organized format, it facilitates informed decision-making to enhance website visibility and drive targeted traffic growth.
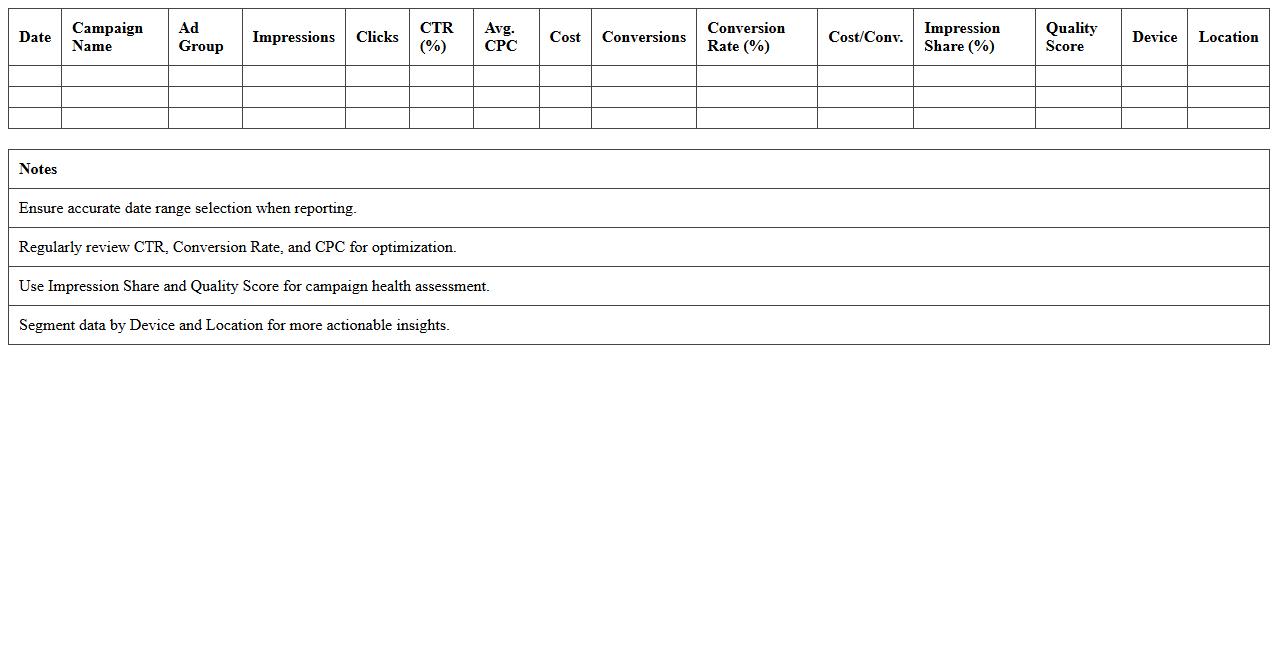
Google Ads Campaign Performance Excel Template
The Google Ads Campaign Performance Excel Template is a
comprehensive tool designed to track, analyze, and visualize key metrics such as click-through rates, conversion rates, cost-per-click, and campaign ROI. It enables marketers to efficiently monitor advertising efforts, identify trends, and optimize budget allocation for improved ad performance. By integrating data into a user-friendly format, this template streamlines decision-making and enhances campaign management precision.
Quarterly Marketing Performance Overview Spreadsheet
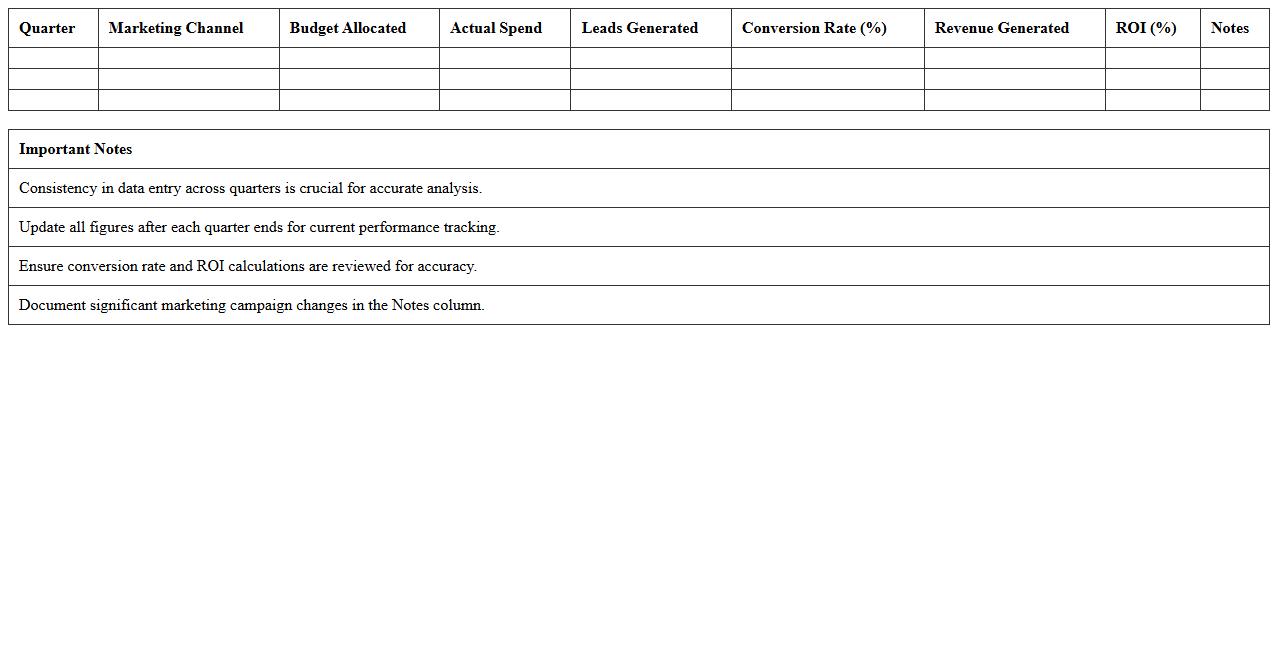
The
Quarterly Marketing Performance Overview Spreadsheet is a comprehensive document that consolidates key marketing metrics such as campaign effectiveness, ROI, customer engagement, and conversion rates for a three-month period. It allows marketers to analyze trends, identify successful strategies, and pinpoint areas needing improvement with clear, data-driven insights. This tool supports informed decision-making, enabling optimized budget allocation and enhanced overall marketing performance.
What custom KPIs are tracked in your Marketing Performance Report Excel?
Our Marketing Performance Report Excel tracks custom KPIs such as Customer Acquisition Cost (CAC), Lifetime Value (LTV), and Conversion Rate. These KPIs are tailored to measure the effectiveness of specific campaigns and overall marketing strategies. We also include metrics like click-through rates and engagement ratios to gain a deeper understanding of campaign success.
How do you segment campaign data within the report for actionable insights?
Campaign data is segmented by demographics, channels, and campaign types to provide clear insights. This segmentation allows marketers to identify high-performing segments and optimize budget allocation. It also highlights areas needing improvement by breaking down performance data in granular detail.
What formulas or automation do you use for ROI calculations?
We use automated formulas such as (Revenue - Marketing Cost) / Marketing Cost for precise ROI calculations. Excel macros and dynamic pivot tables streamline data consolidation and update ROI figures in real-time. This automation reduces manual errors and enhances reporting efficiency.
How is channel-specific performance visualized in your Excel dashboard?
Channel-specific performance is visualized using interactive charts and color-coded heatmaps for quick comprehension. Bar graphs compare conversion rates across channels, while trend lines track performance over time. These visual tools enable stakeholders to make informed decisions at a glance.
How do you ensure data accuracy across multiple marketing data sources?
Data accuracy is maintained through automated data validation rules and cross-referencing between sources. We utilize Excel's data import functions to directly fetch data, minimizing manual entry errors. Regular audits and reconciliation processes are also implemented to ensure integrity.