The Marketing Performance Dashboard Excel Template for Digital Agencies offers a streamlined way to track key metrics such as ROI, conversion rates, and campaign effectiveness in one visually clear interface. It enables digital agencies to make data-driven decisions by consolidating complex data into customizable charts and tables. This template enhances reporting accuracy and saves time by automating the aggregation of marketing performance data.
Social Media Performance Tracker - Digital Agency Excel Template
The
Social Media Performance Tracker - Digital Agency Excel Template is a comprehensive tool designed to monitor and analyze key metrics across various social media platforms, enabling businesses to evaluate campaign effectiveness and audience engagement. It provides detailed insights into follower growth, post reach, click-through rates, and conversion statistics, facilitating data-driven decision-making for marketing strategies. Using this template helps digital agencies streamline reporting, optimize content performance, and improve ROI by identifying trends and areas for improvement.
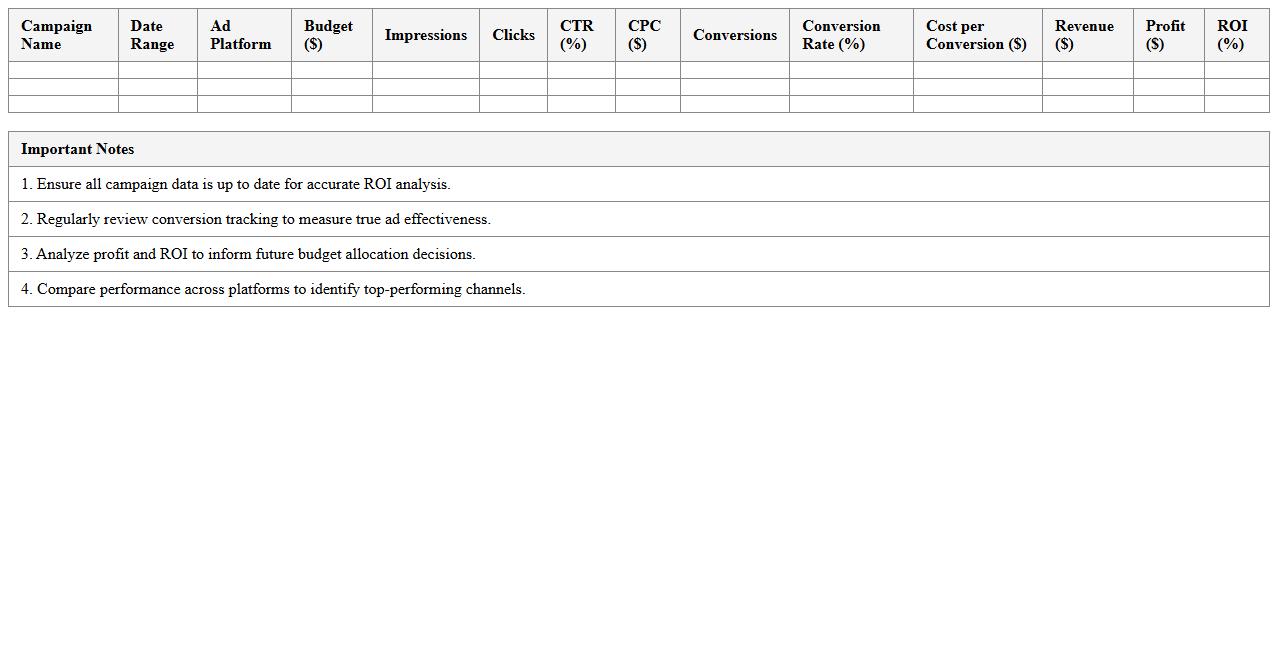
PPC Campaign ROI Analysis Dashboard - Excel Template
The
PPC Campaign ROI Analysis Dashboard Excel Template is a powerful tool designed to track and evaluate the return on investment from pay-per-click advertising campaigns. It consolidates key metrics such as click-through rates, cost per click, conversion rates, and revenue generated to provide a clear, data-driven overview of campaign performance. This dashboard helps marketers optimize budget allocation, enhance ad effectiveness, and make informed decisions to maximize overall advertising profitability.
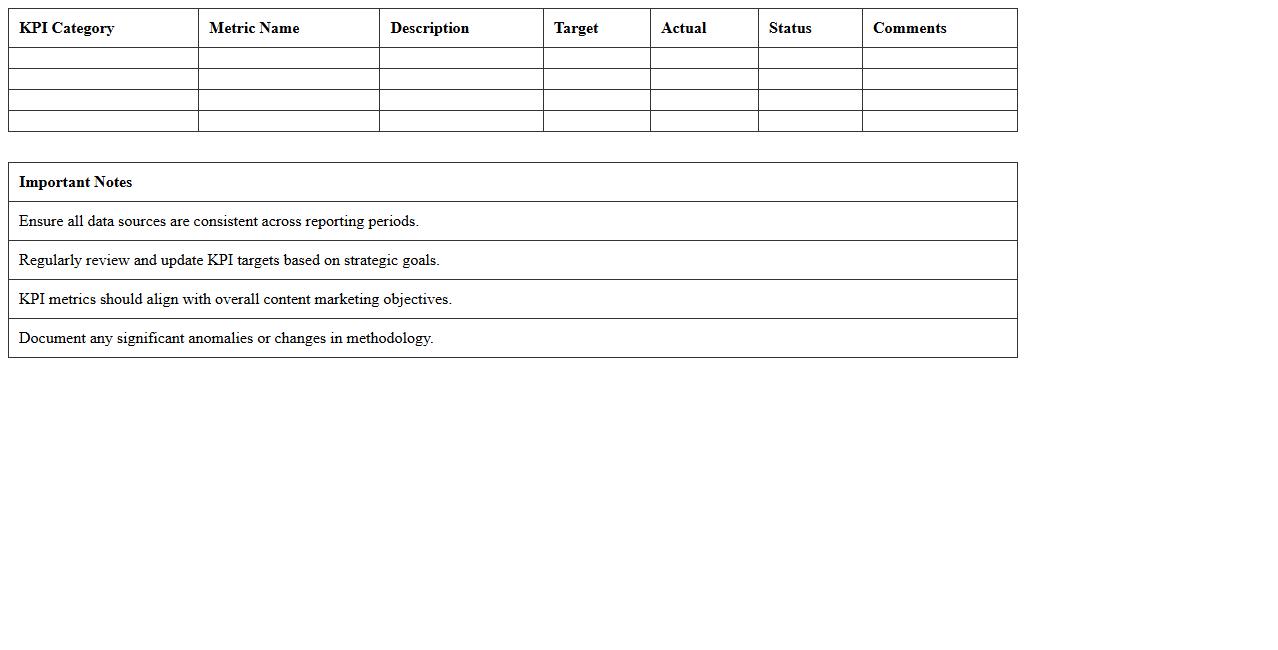
Content Marketing KPI Report - Excel Spreadsheet
A
Content Marketing KPI Report Excel Spreadsheet document tracks key performance indicators such as engagement rates, conversion metrics, and content reach to measure the effectiveness of marketing strategies. It enables marketers to analyze data trends, identify successful content types, and optimize future campaigns for maximum ROI. The spreadsheet format allows easy customization, data visualization, and real-time updates to support data-driven decision making.
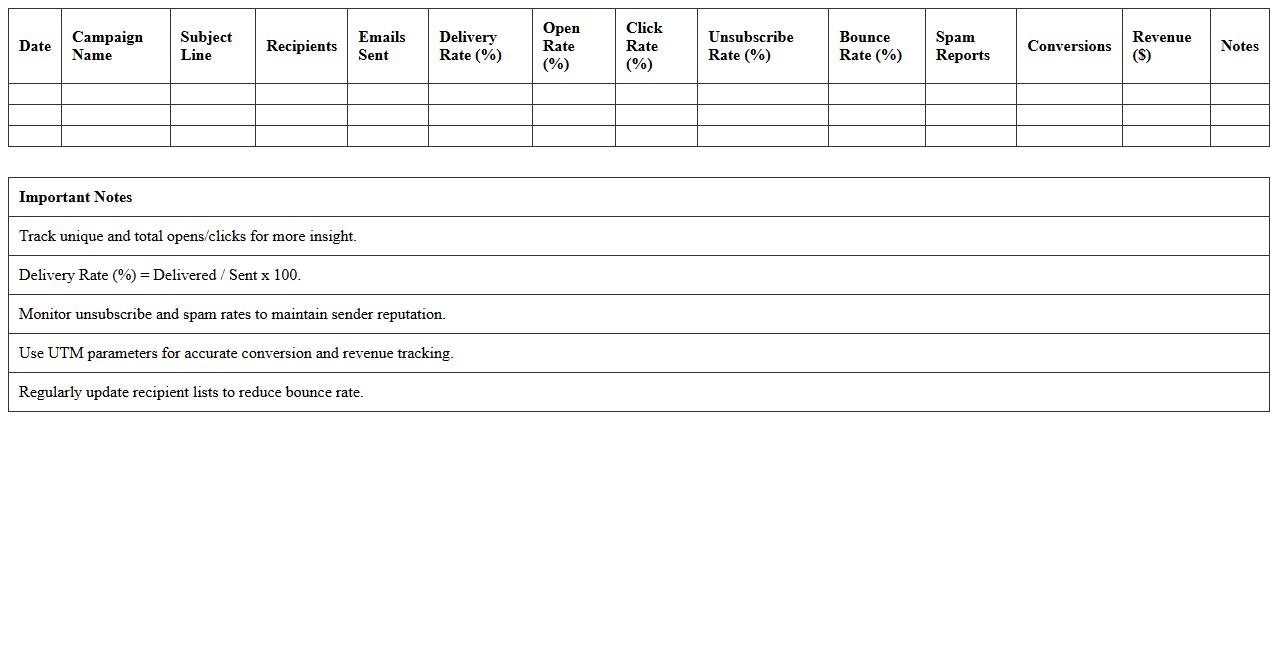
Email Marketing Metrics Dashboard - Excel XLSX
An
Email Marketing Metrics Dashboard in Excel XLSX format is a powerful tool that consolidates key performance indicators such as open rates, click-through rates, conversion rates, and bounce rates into a single, organized interface. It enables marketers to quickly analyze campaign effectiveness, identify trends, and make data-driven decisions to optimize future email strategies. This dashboard also enhances reporting efficiency by providing visual insights and easy export options for stakeholder communication.
Website Traffic & Lead Generation Tracker - Excel Sheet
A
Website Traffic & Lead Generation Tracker Excel sheet document organizes and analyzes data on visitors and potential customers, helping businesses monitor sources of traffic, user behavior, and conversion rates. This tool enables identification of high-performing marketing channels and patterns to optimize campaigns and improve lead quality. By providing clear insights into website performance, it supports informed decision-making and enhances overall digital marketing strategies.
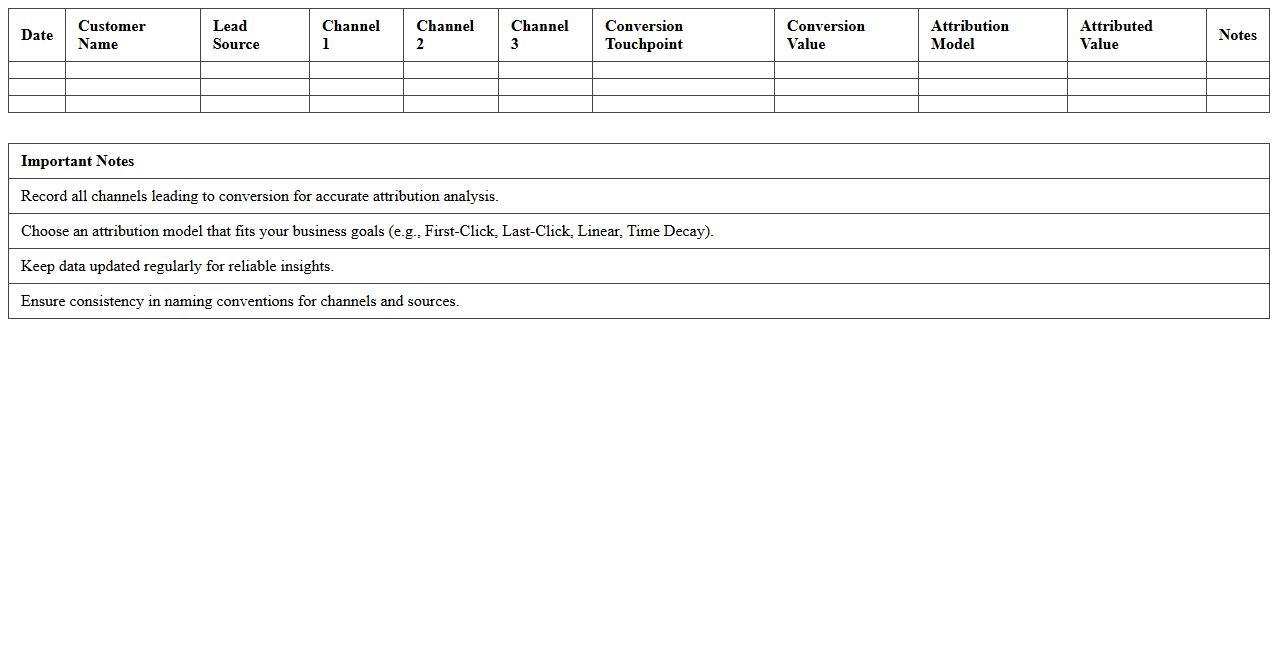
Multi-Channel Marketing Attribution Template - Excel
A
Multi-Channel Marketing Attribution Template in Excel is a tool designed to track and analyze the performance of various marketing channels by assigning credit to each touchpoint along the customer journey. It helps businesses understand which channels drive conversions and optimize budget allocation for maximum ROI. By consolidating data from multiple campaigns, the template provides clear insights that enhance decision-making and marketing strategy effectiveness.
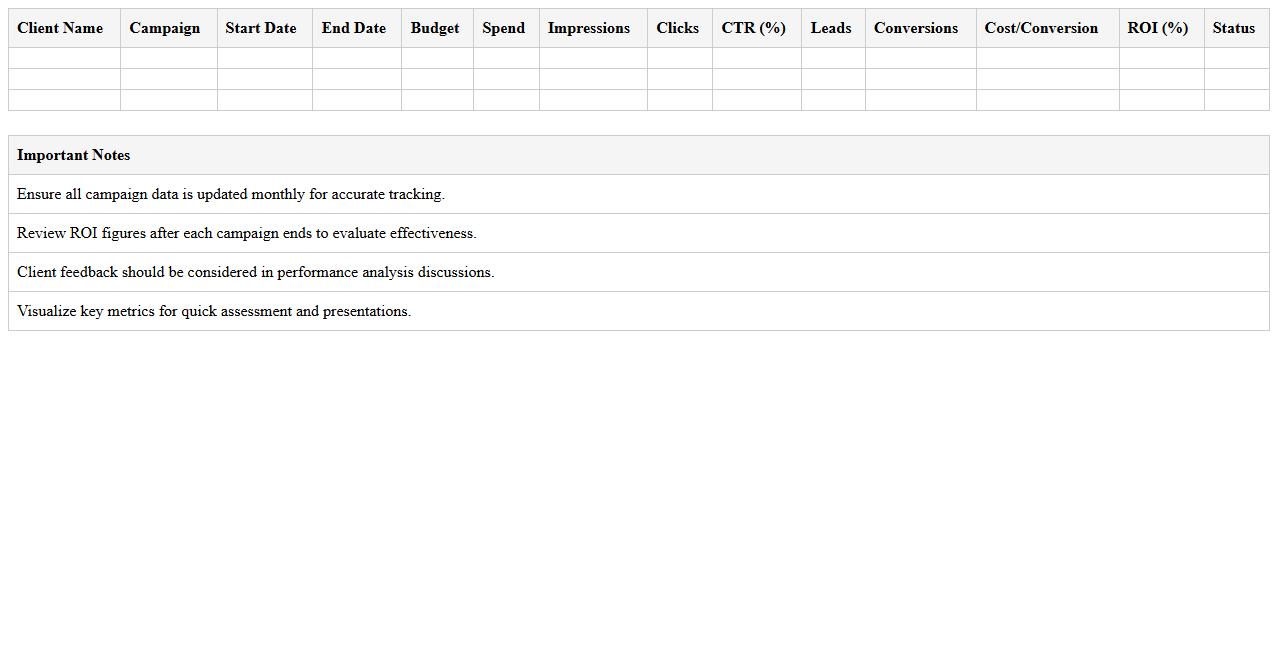
Client Marketing Performance Overview - Excel Dashboard
The
Client Marketing Performance Overview - Excel Dashboard document consolidates key marketing metrics and campaign results into an interactive and visually accessible format. It enables marketers and stakeholders to track ROI, conversion rates, and engagement metrics in real-time, facilitating data-driven decision-making. By quickly identifying trends and performance gaps, this dashboard enhances strategic planning and optimizes marketing efforts for better client outcomes.
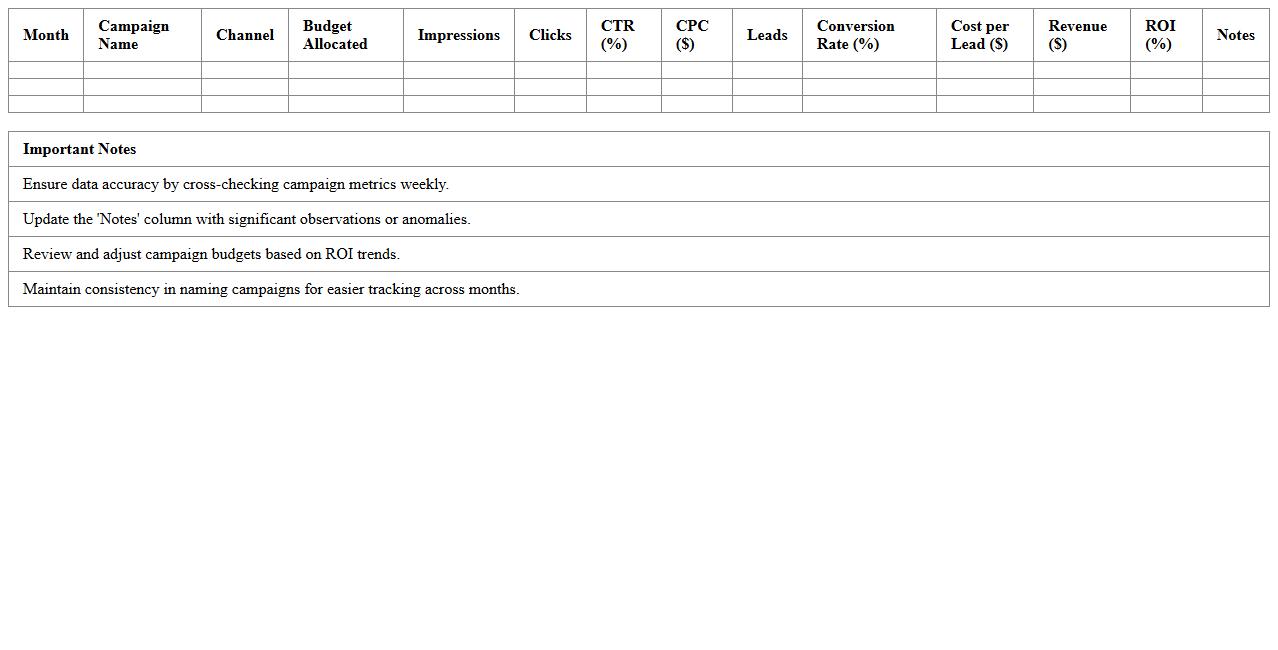
Monthly Digital Campaign Analytics Report - XLS Template
The
Monthly Digital Campaign Analytics Report - XLS Template is a structured spreadsheet designed to track, analyze, and visualize key performance metrics of digital marketing campaigns on a monthly basis. It helps marketers monitor data such as impressions, clicks, conversions, and ROI, enabling data-driven decisions to optimize campaign effectiveness. This template saves time by providing a consistent framework for reporting while enhancing clarity and communication of campaign results across teams.
SEO Ranking & Keyword Tracking Excel Template
The
SEO Ranking & Keyword Tracking Excel Template document is a powerful tool designed to monitor and analyze the performance of keywords on search engines, helping businesses improve their online visibility. It allows users to track keyword rankings over time, identify trends, and optimize their SEO strategies based on data-driven insights. By consolidating ranking information in one easy-to-use format, this template enhances decision-making and boosts digital marketing effectiveness.
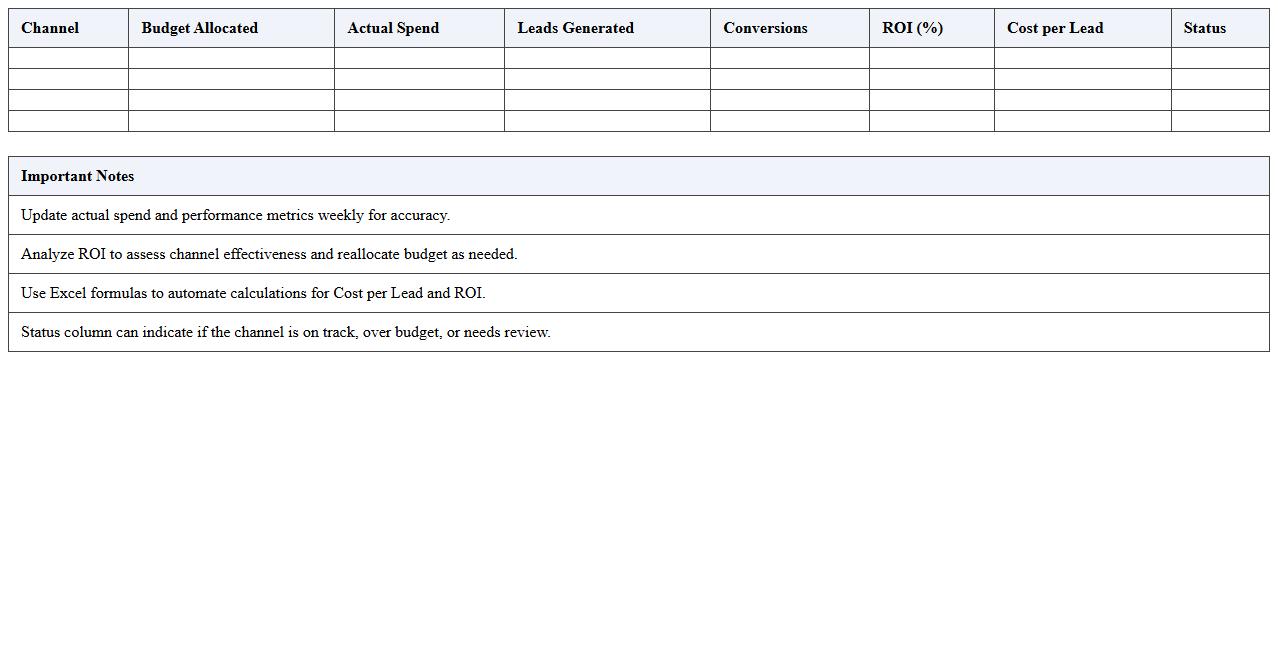
Marketing Budget vs. Performance Dashboard - Excel File
The
Marketing Budget vs. Performance Dashboard Excel file is a dynamic document that tracks and compares planned marketing expenditures against actual campaign results, enabling precise financial oversight. It aggregates key metrics such as ROI, cost-per-acquisition, and conversion rates to visualize performance trends and optimize budget allocation. This tool is invaluable for making data-driven decisions, ensuring marketing investments yield maximum impact and identifying areas for strategic adjustment.
How can I customize the dashboard KPIs to track specific digital campaign goals?
To customize your dashboard KPIs effectively, identify key metrics aligned with each digital campaign's objectives. Use dynamic data ranges and filters to display real-time campaign performance. Incorporate goal-specific indicators such as conversion rates, click-through rates, and cost per acquisition for targeted insights.
What Excel formulas best automate ROI calculations for multi-channel marketing?
Excel formulas like =SUM and =SUMPRODUCT help aggregate costs and revenues across channels. Use =IF statements to handle conditional ROI calculations based on campaign success criteria. Automate ROI as (Total Revenue - Total Cost) / Total Cost to track profitability dynamically for each marketing channel.
How do I visualize client performance trends using dynamic charts in the dashboard?
Dynamic charts utilize data ranges that automatically update with new performance data, providing real-time trend visualization. Employ features like pivot tables and slicers to make trend analysis interactive and customizable. Choose chart types such as line, bar, or combo to best represent the client's KPIs and growth patterns.
Can the template segment data by service (SEO, PPC, Social Media) for clearer reporting?
Yes, the template supports data segmentation by service categories such as SEO, PPC, and Social Media. Use filtering functions or pivot tables to isolate and compare performance metrics per service. This segmentation enhances clarity and enables focused analysis for each marketing channel.
How do I set up automated monthly performance snapshots for agency clients in Excel?
Automate monthly performance snapshots using macros or VBA scripts to capture date-stamped reports at regular intervals. Combine this with dynamic ranges and scheduled data refreshes to ensure up-to-date insights. Save each snapshot in separate sheets or external files for historical client performance tracking.
More Marketing Excel Templates