The Manufacturing Quality Control Excel Template for Product Inspections streamlines the process of tracking and analyzing inspection results to ensure product standards are consistently met. It offers customizable fields for defect identification, batch numbers, and inspection dates, enhancing accuracy and efficiency in quality management. This template supports data-driven decision-making, reducing errors and improving overall manufacturing quality control.
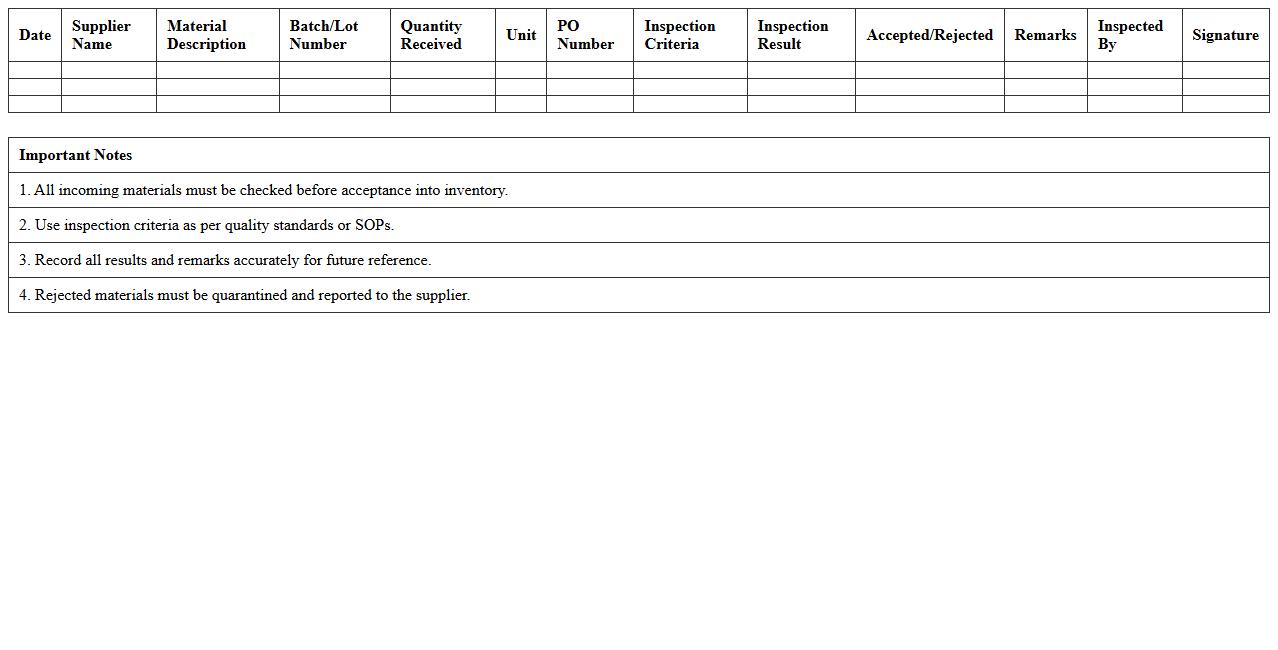
Incoming Material Inspection Log Template
The
Incoming Material Inspection Log Template is a structured document used to record and track the quality and specifications of materials received from suppliers. This log ensures accurate documentation of inspections, helping teams identify defects and maintain compliance with quality standards. Utilizing this template improves inventory control, reduces the risk of faulty materials entering production, and supports overall supply chain efficiency.
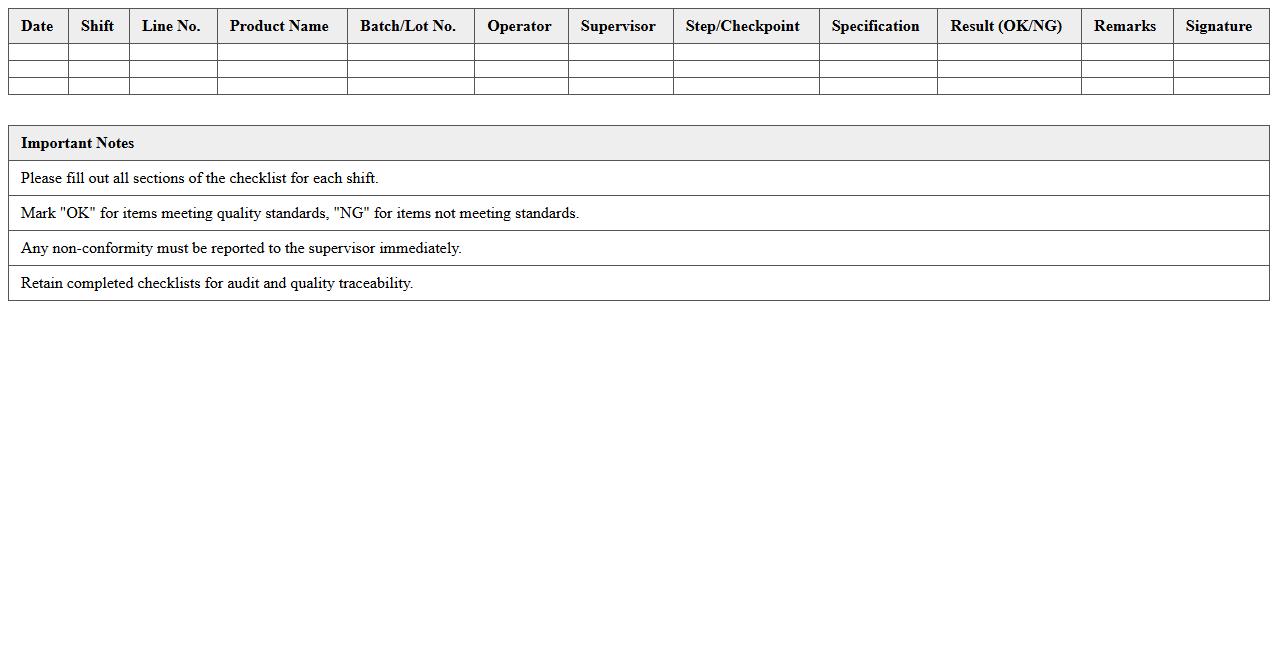
Production Line Quality Checklist Sheet
The
Production Line Quality Checklist Sheet is a detailed document used to ensure that every stage of the manufacturing process meets predefined quality standards. It helps identify defects, monitor compliance with specifications, and maintain consistent product quality by systematically verifying each production step. Utilizing this checklist reduces errors, enhances efficiency, and supports continuous improvement in industrial operations.
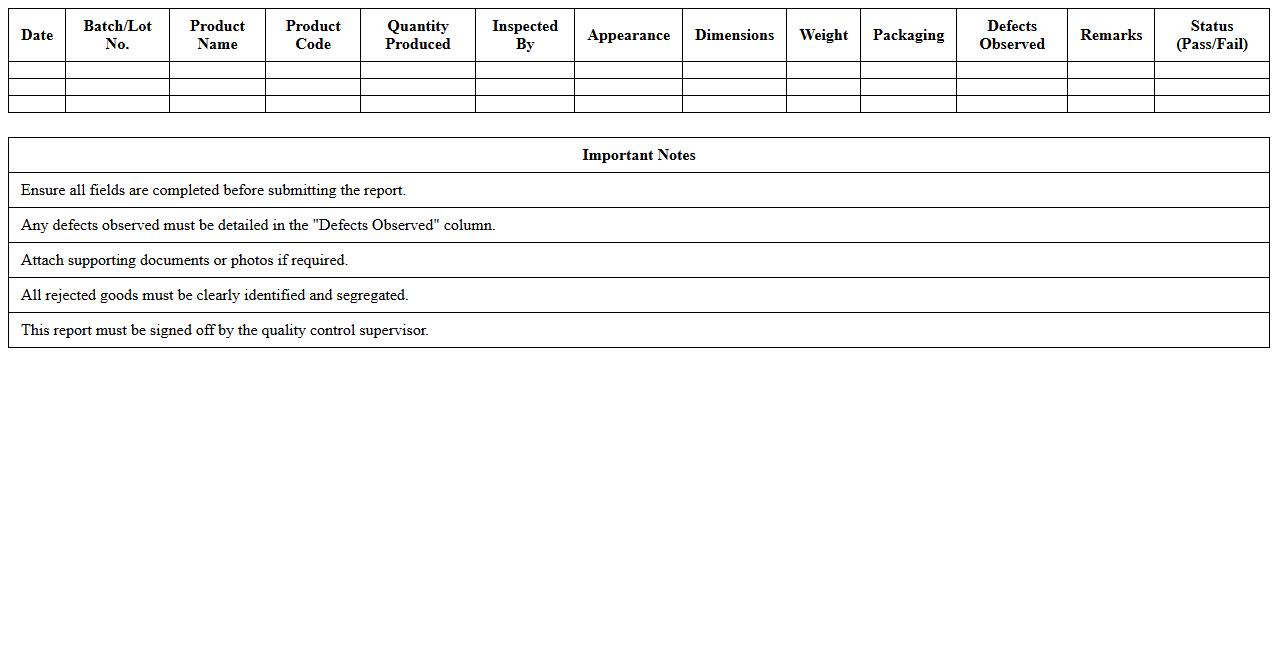
Finished Goods Quality Control Report
A
Finished Goods Quality Control Report documents the inspection results of final products to ensure they meet specified quality standards before shipment. This report helps identify defects, verify compliance with customer requirements, and supports continuous improvement in manufacturing processes. By providing detailed quality metrics, it aids in reducing returns, enhancing customer satisfaction, and maintaining brand reputation.
Defective Product Cause Analysis Tracker
The
Defective Product Cause Analysis Tracker document systematically records and analyzes root causes of product defects to improve quality control processes. It helps identify recurring issues, enabling targeted corrective actions and reducing future defect rates. By providing clear visibility into defect trends, the tracker enhances decision-making and supports continuous improvement initiatives.
Inspection Result Summary Dashboard
The
Inspection Result Summary Dashboard document consolidates critical data from inspection activities into a visually accessible format, enabling quick assessment of quality and compliance across various processes. It helps organizations identify patterns, track defect rates, and address issues proactively, improving overall operational efficiency. By providing real-time insights into inspection outcomes, it supports informed decision-making and drives continuous improvement initiatives.
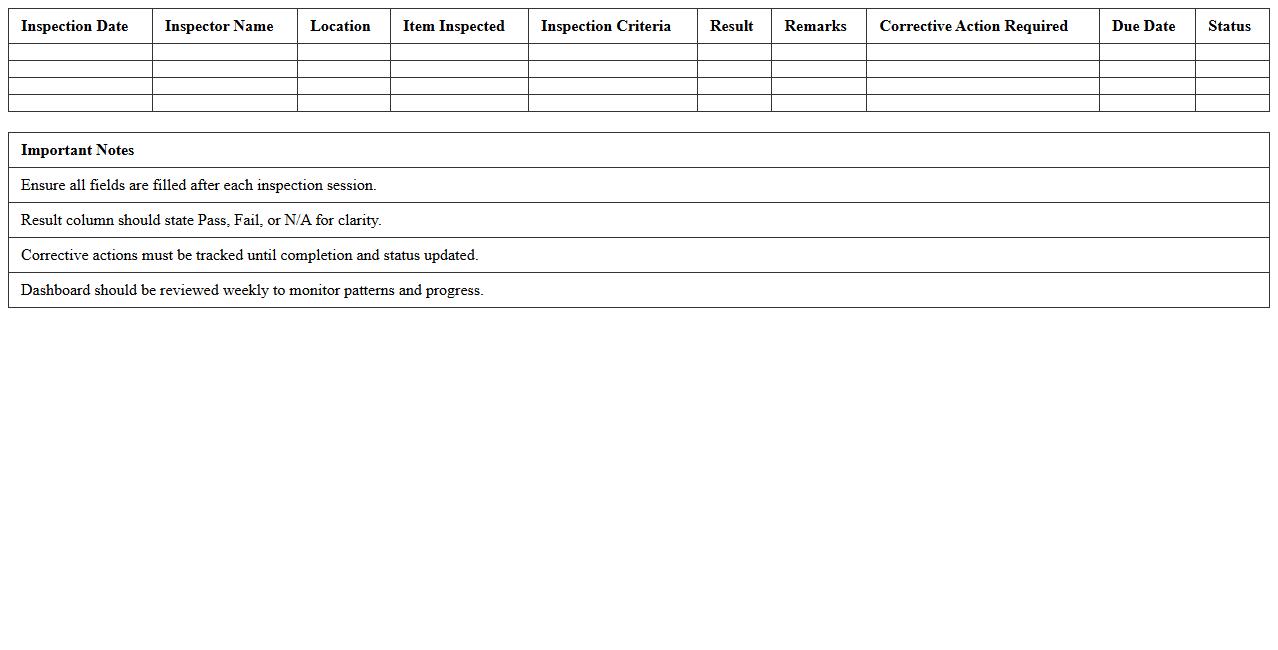
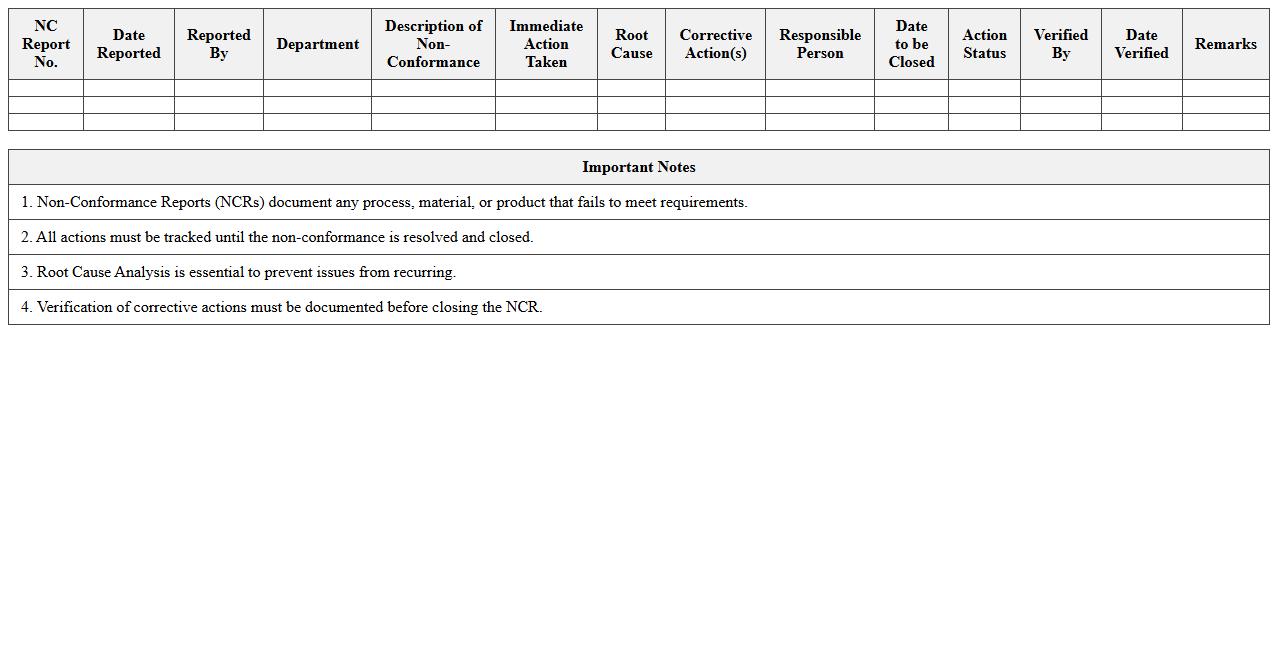
Non-Conformance Report and Action Log
A
Non-Conformance Report (NCR) and Action Log document is a critical quality management tool used to identify, document, and track deviations from established standards or project specifications. This document helps organizations systematically address non-conformities by defining corrective actions, assigning responsibilities, and monitoring progress to ensure issues are resolved promptly. Using an NCR and Action Log enhances accountability, improves process compliance, and drives continuous improvement in operational efficiency.
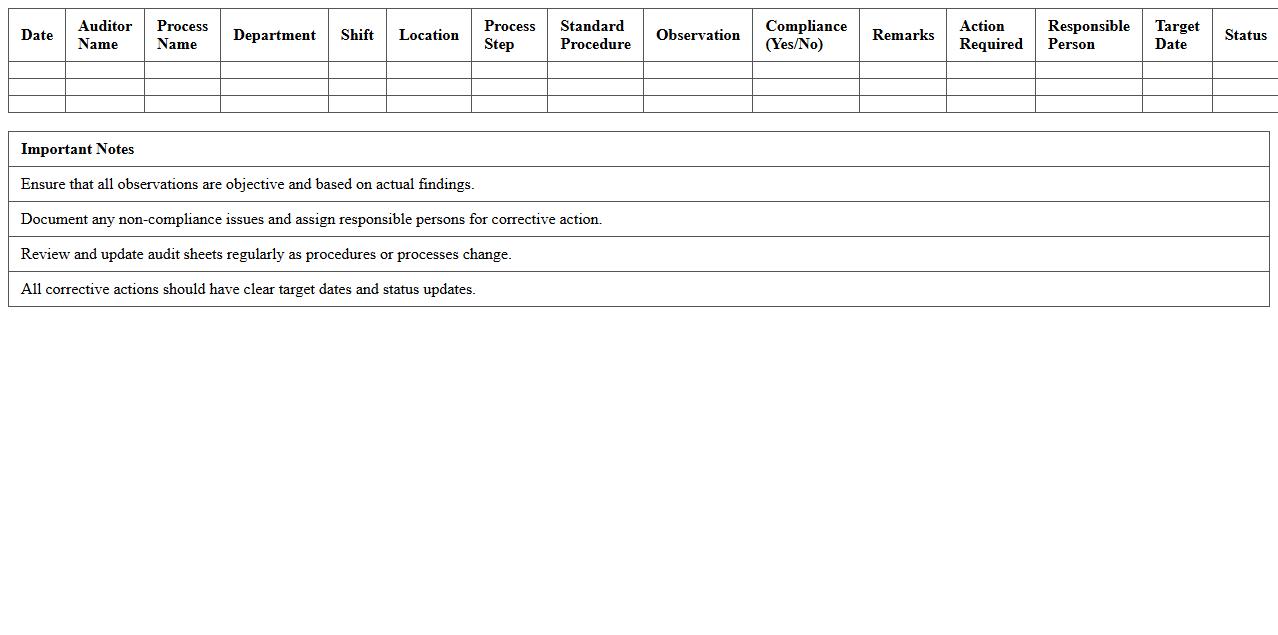
Manufacturing Process Audit Sheet
A
Manufacturing Process Audit Sheet is a detailed document used to evaluate and verify the efficiency, compliance, and quality of manufacturing operations. It helps identify discrepancies, ensures adherence to standard operating procedures, and facilitates continuous improvement by providing a structured framework for auditing production processes. This document is essential for maintaining product consistency, reducing defects, and enhancing overall operational performance.
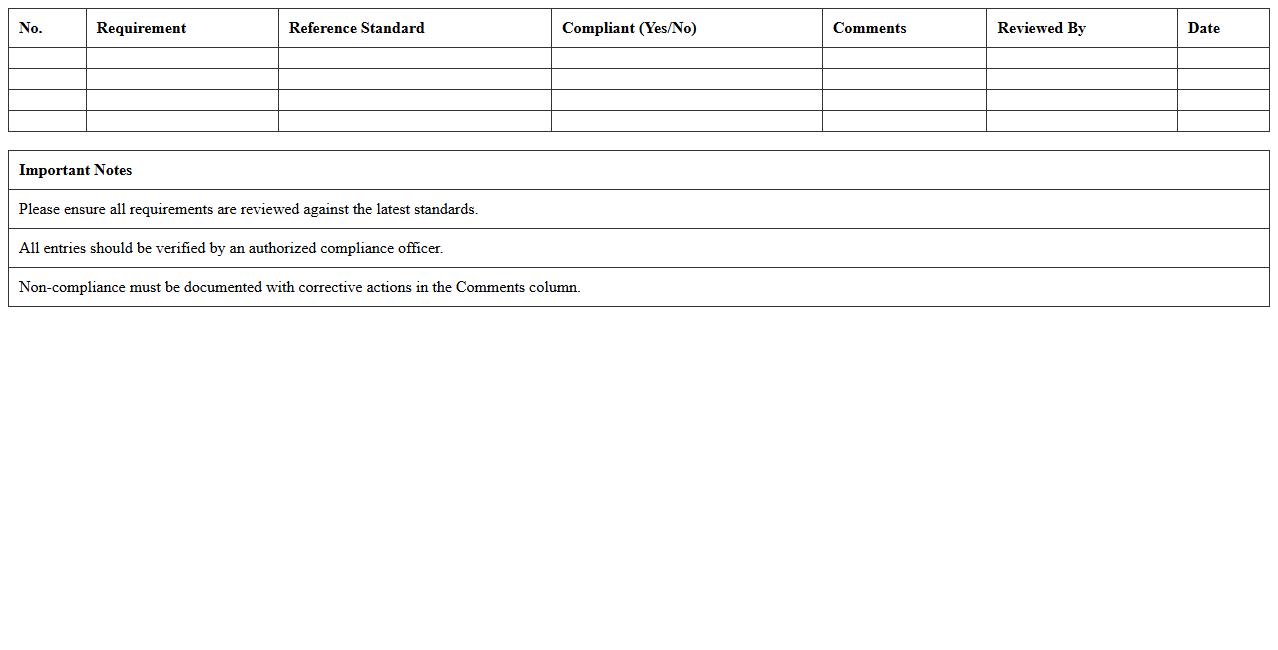
Product Compliance Verification Checklist
A
Product Compliance Verification Checklist document systematically ensures that a product meets all regulatory, safety, and quality standards required by industry and government authorities. It helps identify potential non-compliance issues early in the development process, reducing risks of recalls, fines, or market withdrawal. By providing a clear framework for verification, this checklist streamlines audits, supports consistent product quality, and enhances customer trust.
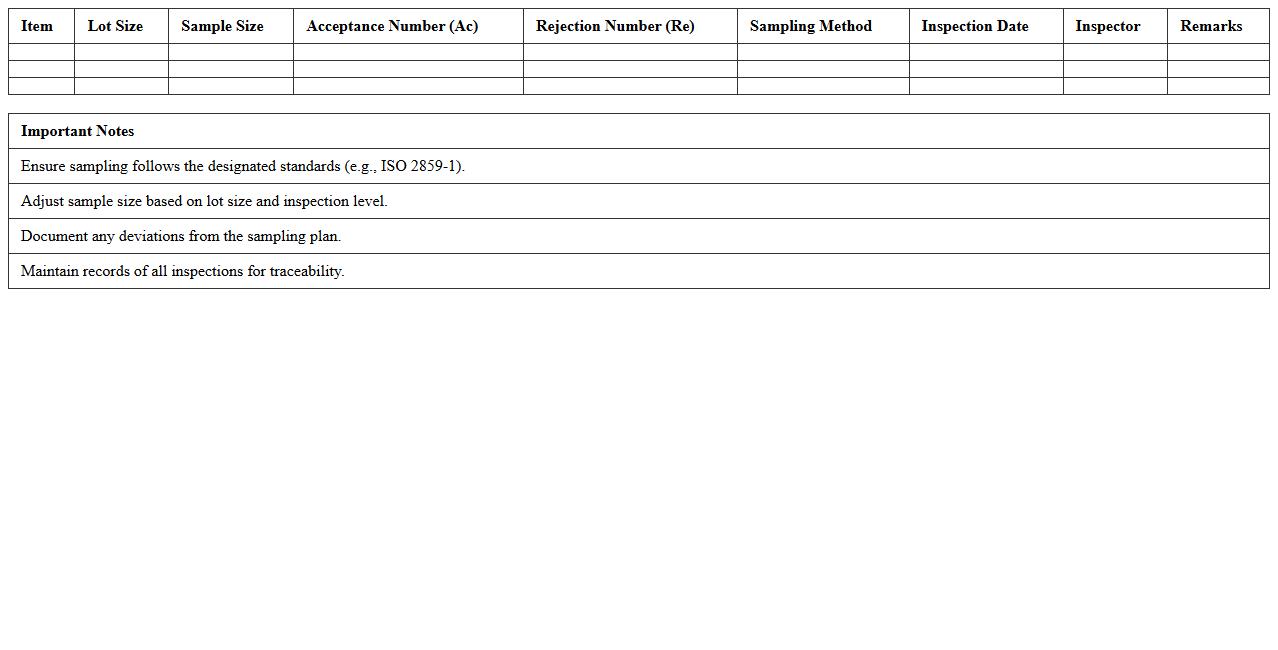
Quality Control Sampling Plan Template
A
Quality Control Sampling Plan Template document outlines systematic procedures for selecting and evaluating sample units from a production lot to ensure conformity with predefined quality standards. It helps organizations minimize inspection costs and time by specifying sample size, acceptance criteria, and testing methods, thereby enhancing decision-making efficiency. Utilizing this template aids in maintaining consistent product quality and reducing the risk of defects reaching customers.
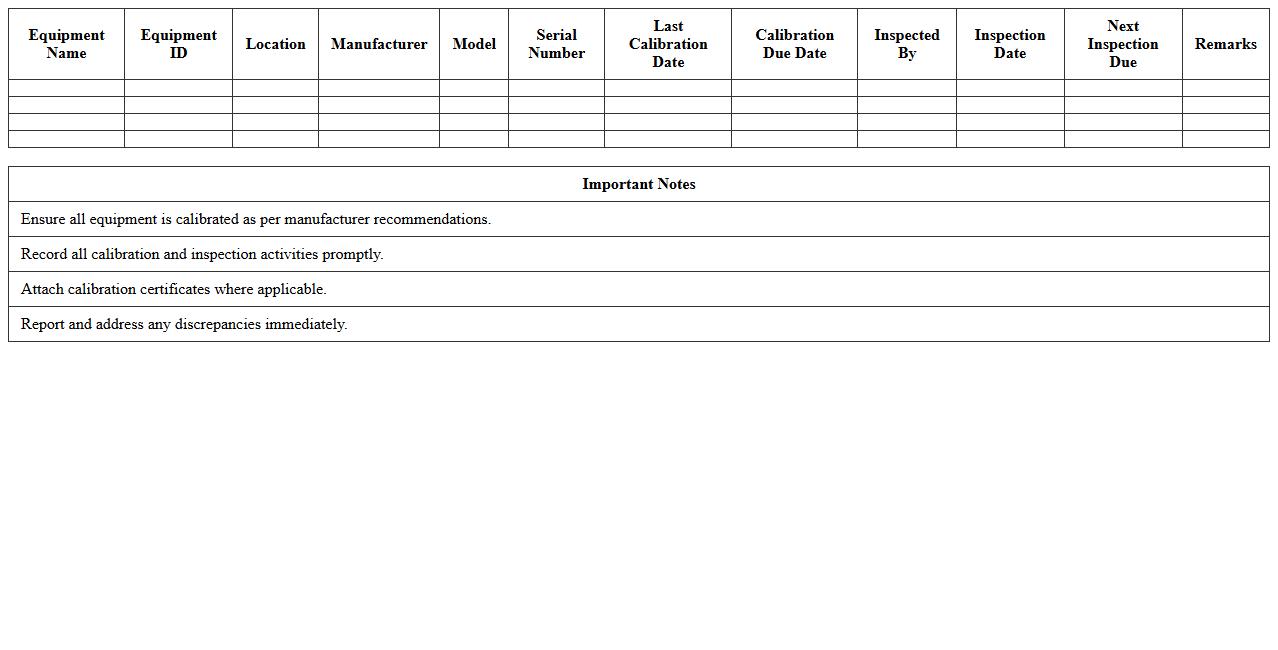
Equipment Calibration and Inspection Record
The
Equipment Calibration and Inspection Record document tracks the accuracy and condition of equipment by documenting calibration dates, inspection results, and maintenance actions. This record ensures compliance with industry standards, reduces equipment downtime, and enhances operational safety. Maintaining precise calibration and inspection logs helps organizations prevent measurement errors and extend equipment lifespan.
How can conditional formatting in Excel highlight non-conforming inspection results in manufacturing QC reports?
Conditional formatting in Excel allows you to visually identify non-conforming inspection results by applying color codes to cells that fail quality criteria. By setting rules based on numeric thresholds or text conditions, QC reports instantly differentiate defective products from compliant ones. This technique enhances clarity and accelerates the review process for manufacturing quality control.
What are effective Excel formulas for tracking defect rates across product batches in real-time?
Formulas such as =COUNTIF() and =SUMPRODUCT() can dynamically calculate defect rates by counting defects relative to total inspections in each batch. Combined with data tables and live cell references, these formulas provide real-time monitoring of defect trends for continual improvement. Automating these calculations ensures accurate and up-to-date quality metrics in manufacturing reports.
How do you automate trend analysis for recurring quality issues using pivot tables in QC inspection logs?
Pivot tables enable automation of trend analysis by summarizing inspection log data and grouping defects over time or by defect type. By refreshing pivot tables regularly, manufacturers can detect recurring quality issues quickly and focus corrective actions effectively. Adding slicers and filters further customizes the analysis, enhancing visibility into production quality patterns.
What data validation techniques ensure accurate entry of critical specifications in manufacturing inspection sheets?
Data validation in Excel restricts inputs to predefined criteria, such as lists, numeric ranges, or date limits, ensuring accurate data entry of critical manufacturing specifications. Using dropdown menus and error alerts prevents invalid or inconsistent data, which is vital to maintaining reliability in QC records. This method reduces errors at the source and improves overall data integrity in inspection sheets.
Which Excel chart types best visualize pass/fail rates for lot-based product inspections?
Bar charts and stacked column charts are optimal for depicting pass/fail rates by product lot, offering clear comparisons between compliant and defective items. Pie charts can also effectively illustrate the proportion of passing versus failing inspections for a single lot. Selecting the right chart type enhances communication of quality outcomes in manufacturing reports.
More Manufacturing Excel Templates