Human Resource Excel Template for Diversity Reporting streamlines the process of tracking and analyzing workforce diversity metrics, enabling organizations to monitor gender, ethnicity, age, and other demographic data effectively. This customizable template simplifies data collection, visualization, and reporting, ensuring compliance with regulatory requirements and supporting diversity and inclusion initiatives. Rich with formulas and charts, it helps HR professionals gain actionable insights to foster an equitable and inclusive workplace environment.
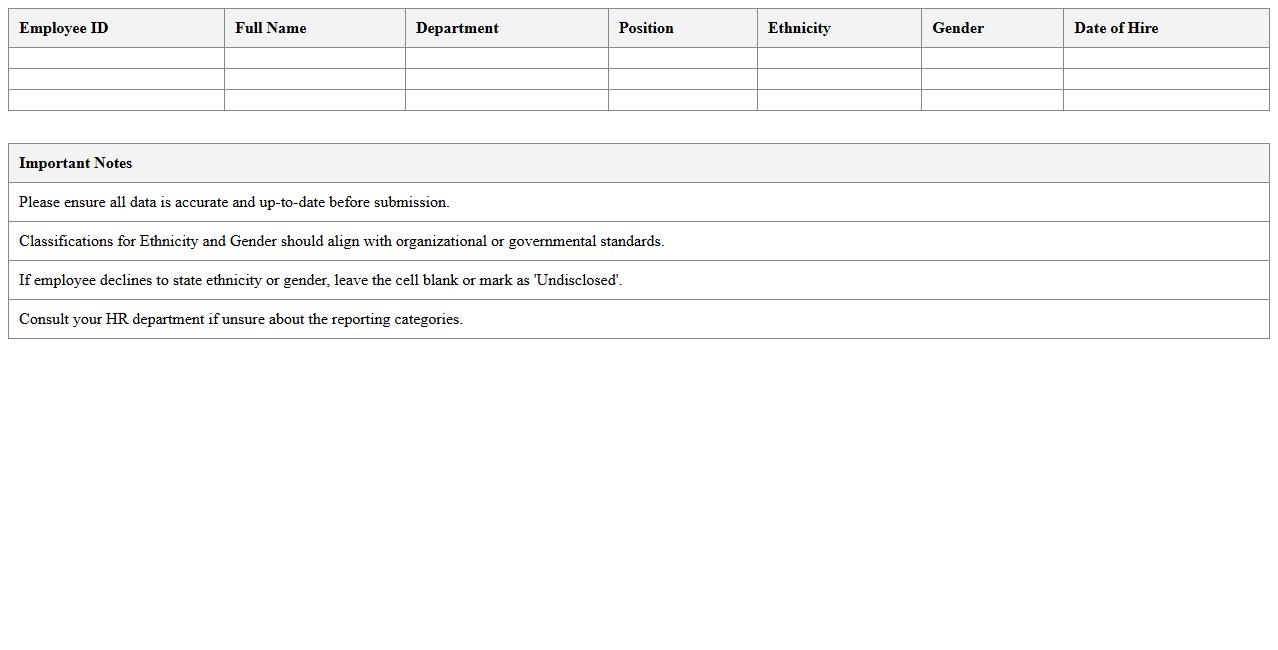
Workforce Diversity Overview Report Excel Template
The
Workforce Diversity Overview Report Excel Template is a comprehensive tool designed to analyze and present employee demographic data, helping organizations track diversity metrics such as gender, age, ethnicity, and job roles. This document enables HR professionals to identify diversity gaps, measure inclusion progress, and generate actionable insights for strategic workforce planning. It enhances decision-making by providing clear visual reports and data summaries that support compliance with diversity policies and foster an inclusive workplace culture.
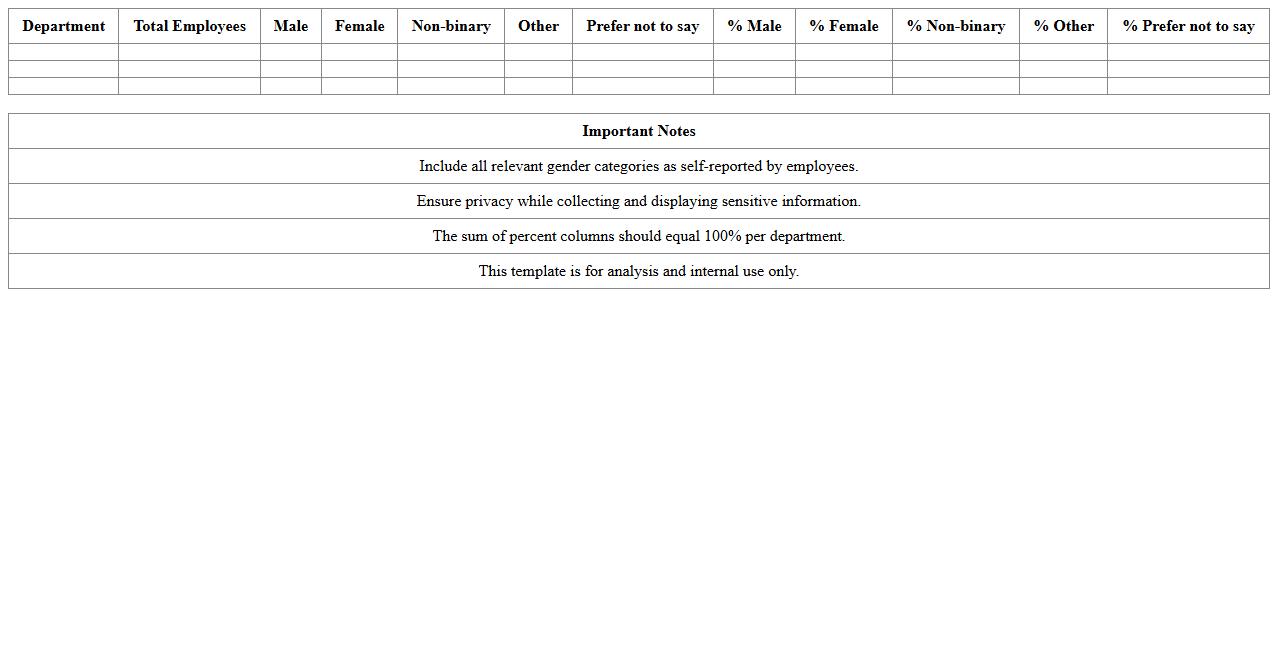
Gender Representation Analysis Excel Template
The
Gender Representation Analysis Excel Template is a structured spreadsheet designed to systematically collect, organize, and analyze data related to gender distribution within organizations or projects. It enables users to identify patterns and disparities in gender representation, supporting informed decision-making and promoting diversity and inclusion initiatives. By utilizing this template, companies can track progress on gender equality goals and develop targeted strategies to foster balanced workforce representation.
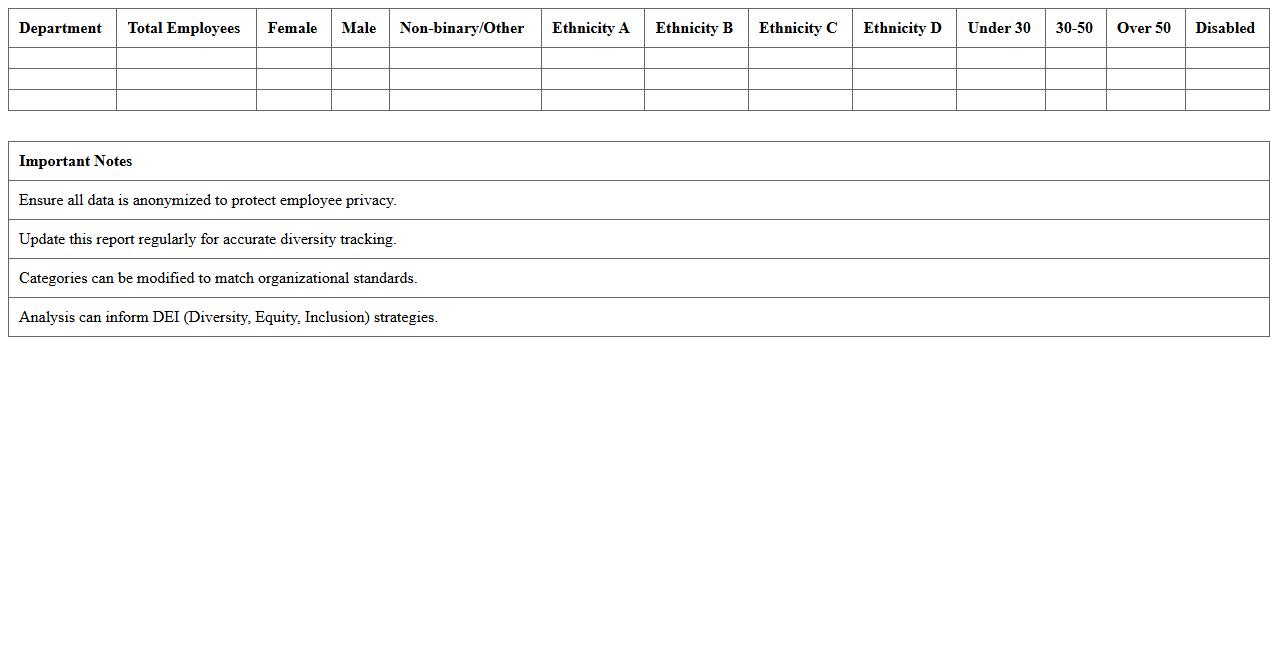
Ethnicity Breakdown Reporting Excel Template
The
Ethnicity Breakdown Reporting Excel Template document is designed to systematically categorize and analyze demographic data based on ethnic groups, facilitating clear visualization and easy interpretation of diversity metrics. This template enables organizations to track representation, identify trends, and ensure compliance with diversity and inclusion initiatives. By providing structured data input and automated summarization, it streamlines reporting processes and supports informed decision-making to foster equitable environments.
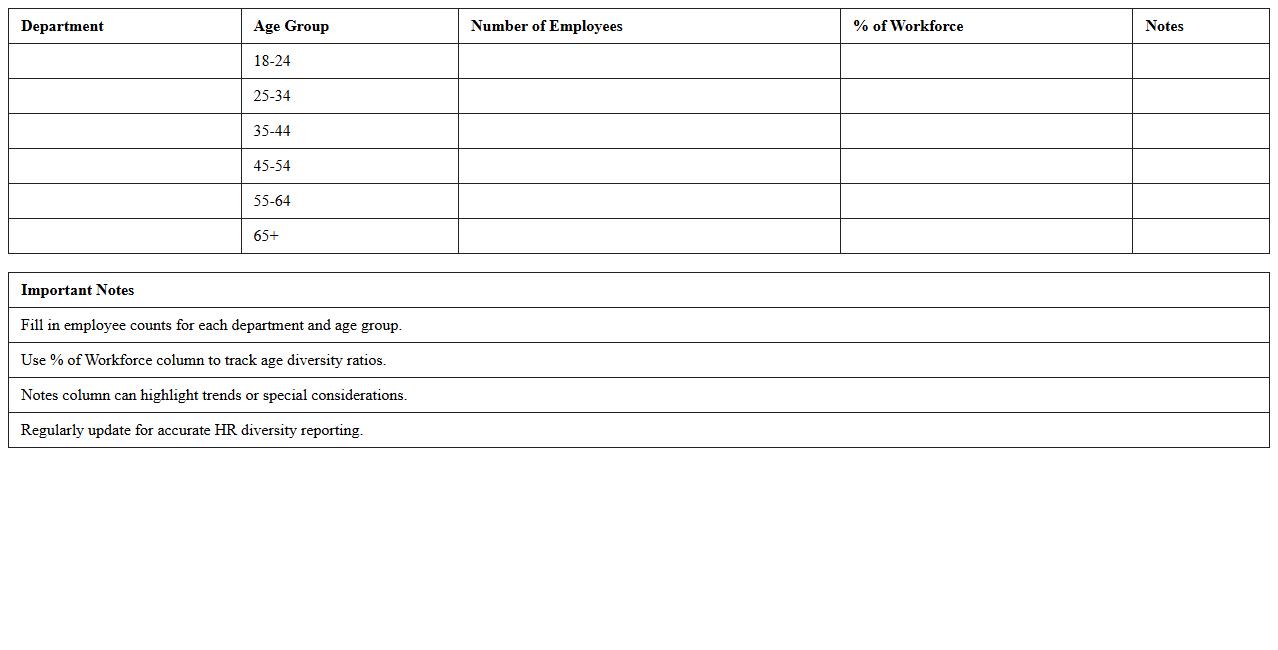
Age Distribution HR Diversity Excel Template
The
Age Distribution HR Diversity Excel Template is designed to analyze and visualize the age demographics within an organization's workforce, helping HR professionals track diversity and plan for talent management. By categorizing employees into specific age groups, this template supports strategic decision-making related to recruitment, succession planning, and retention efforts. Its data-driven insights enable companies to maintain a balanced age profile, fostering an inclusive and dynamic workplace environment.
Recruitment Diversity Tracking Spreadsheet
A
Recruitment Diversity Tracking Spreadsheet is a structured document designed to monitor and analyze diversity metrics throughout the hiring process, capturing data such as candidate demographics, application sources, and interview outcomes. This tool enables organizations to identify gaps in representation, measure progress toward diversity goals, and ensure compliance with equal employment opportunity regulations. Utilizing such a spreadsheet promotes informed decision-making and fosters a more inclusive recruitment strategy.
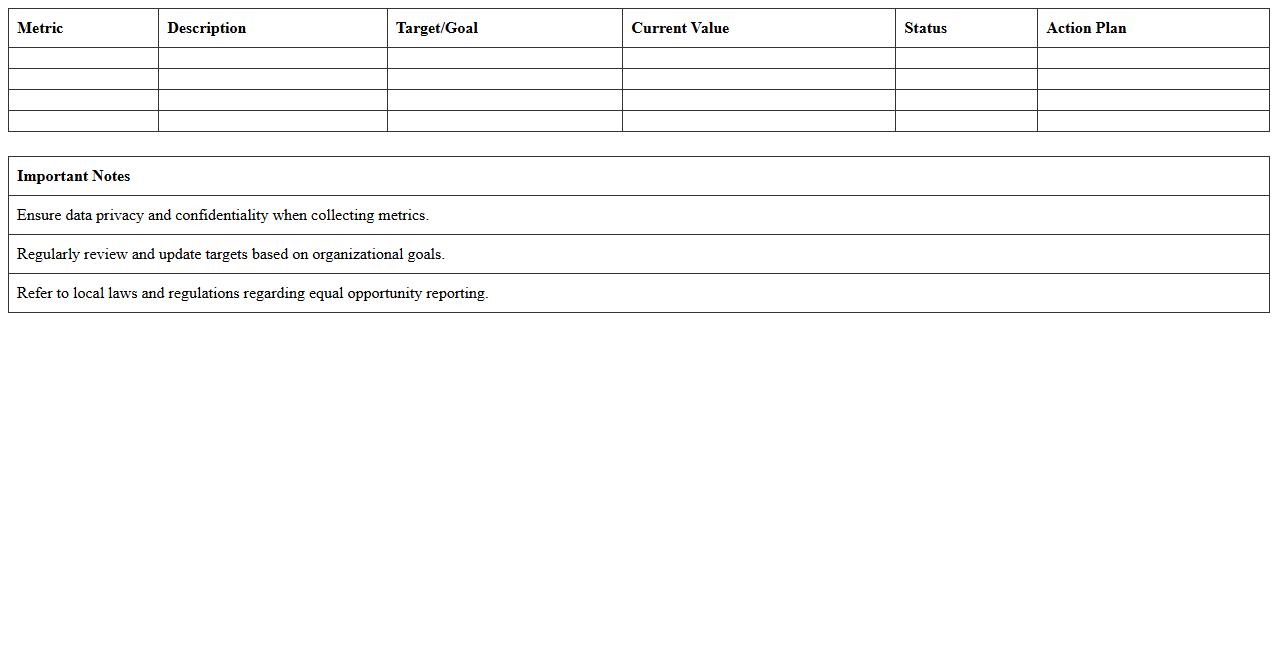
Equal Opportunity Employment Metrics Template
The
Equal Opportunity Employment Metrics Template document is a structured tool designed to track and analyze diversity and inclusion data within an organization. It helps measure compliance with equal employment opportunity laws by capturing demographic information across hiring, promotion, and retention processes. Using this template enables organizations to identify potential biases, promote fair hiring practices, and enhance workplace equity effectively.
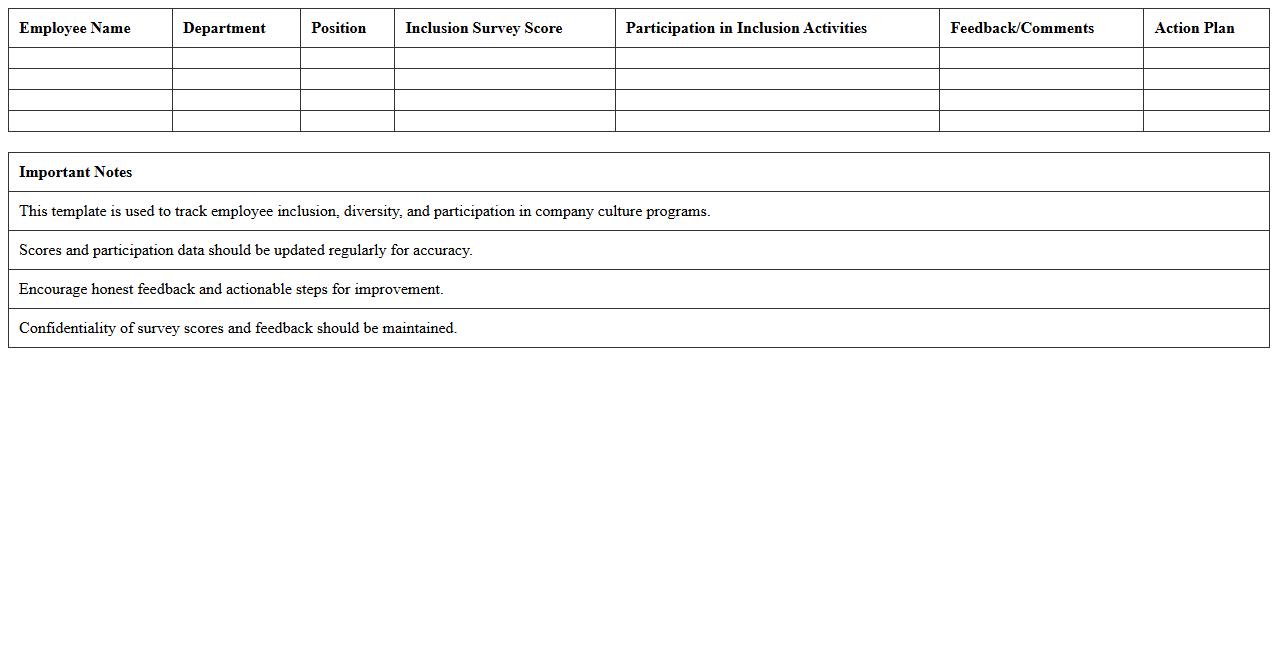
Employee Inclusion Scorecard Excel Template
The
Employee Inclusion Scorecard Excel Template is a structured tool designed to measure and track diversity, equity, and inclusion (DEI) metrics within an organization. By compiling data on employee demographics, engagement, and inclusion initiatives, this template helps identify gaps and monitor progress toward creating a more inclusive workplace. Organizations use it to make informed decisions, enhance employee satisfaction, and drive positive cultural change through data-driven insights.
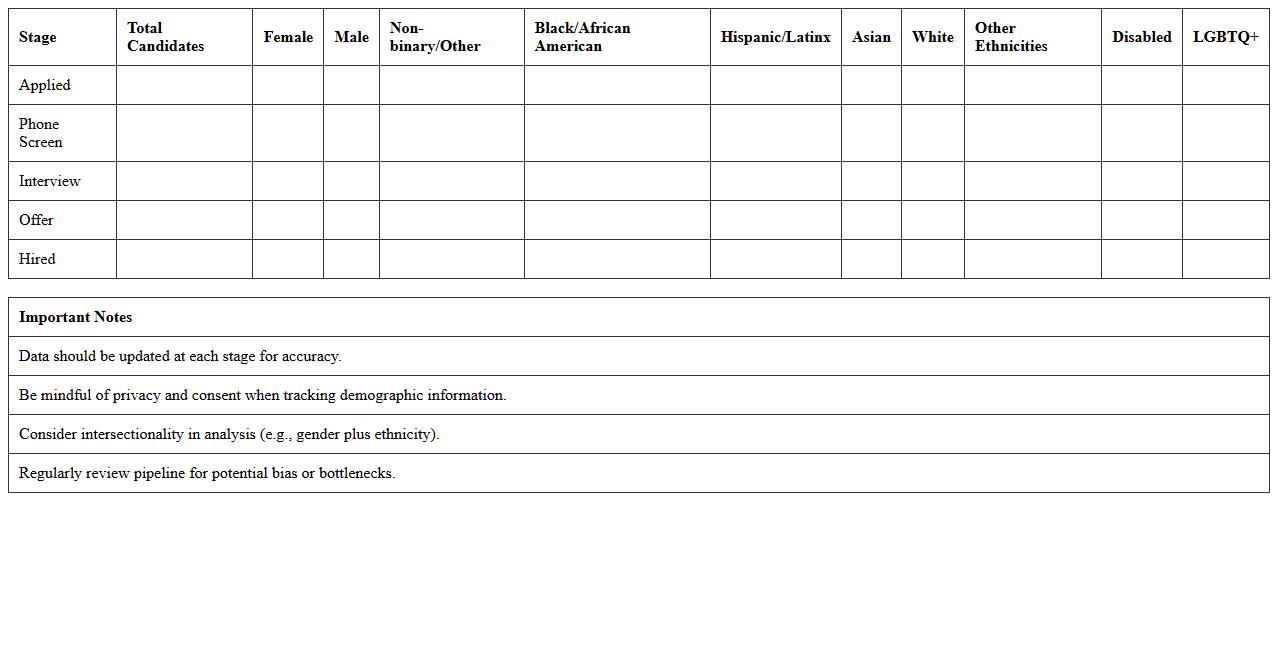
Diversity Hiring Pipeline Report Excel Template
The
Diversity Hiring Pipeline Report Excel Template is a structured document designed to track and analyze diversity metrics throughout the recruitment process. It enables organizations to monitor the representation of various demographic groups at each stage of hiring, helping identify biases and gaps in talent acquisition strategies. By leveraging this template, companies can make data-driven decisions to foster inclusive hiring practices and enhance workforce diversity.
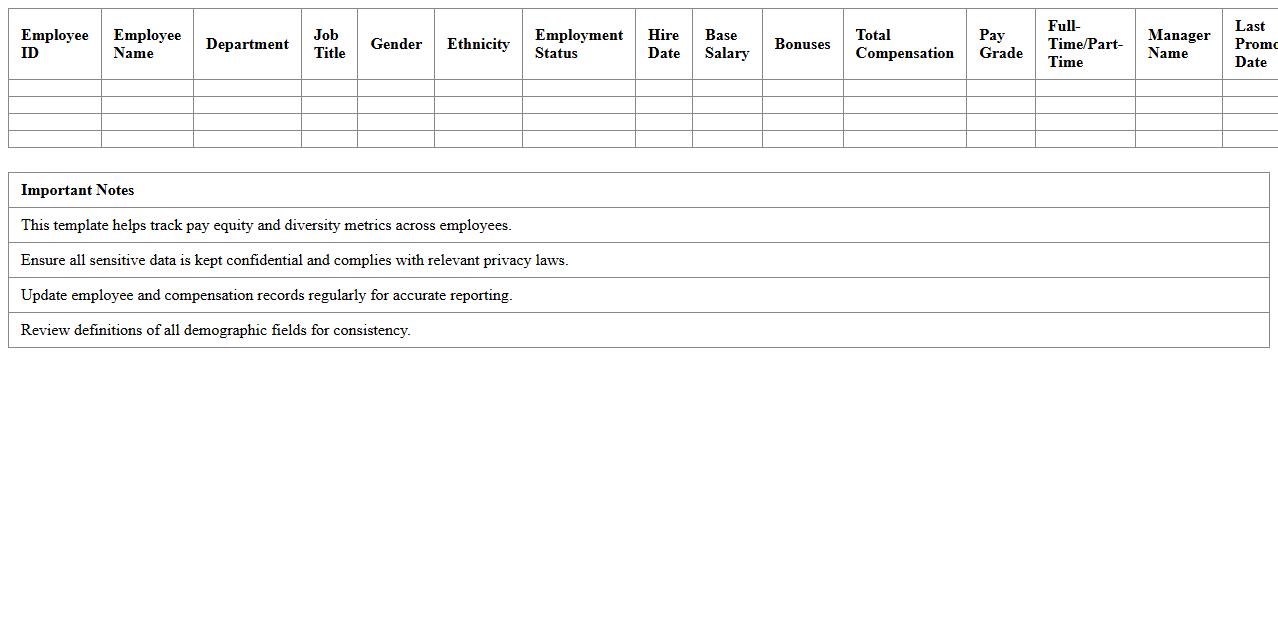
Pay Equity and Diversity Reporting Spreadsheet
The
Pay Equity and Diversity Reporting Spreadsheet is a comprehensive tool designed to track and analyze employee compensation across various demographics, ensuring fairness and compliance with equal pay regulations. It consolidates data on salary, gender, ethnicity, and job roles to identify pay disparities and promote workplace diversity initiatives. Utilizing this spreadsheet enables organizations to make informed decisions, enhance transparency, and support equitable employment practices.
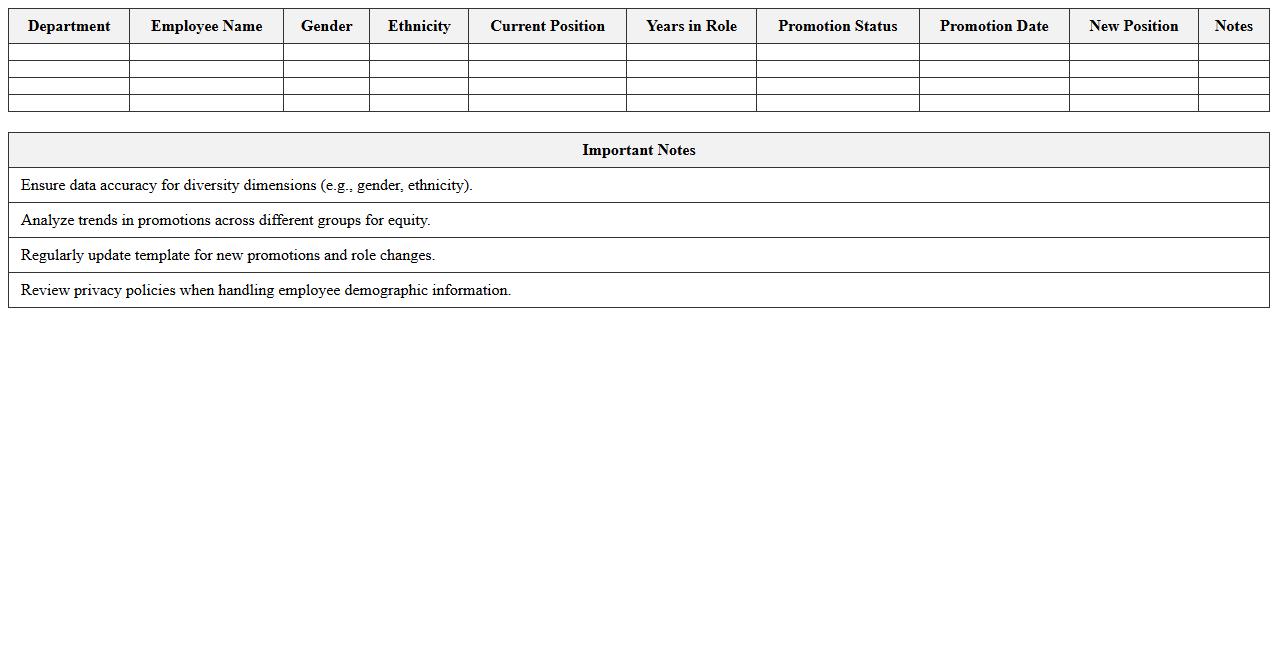
Promotions and Advancement Diversity Analysis Excel Template
The
Promotions and Advancement Diversity Analysis Excel Template is a comprehensive tool designed to track and analyze diversity metrics within employee promotion and advancement processes. It helps organizations identify patterns, disparities, and opportunities for improvement by visually presenting demographic data related to promotions. Utilizing this template supports informed decision-making to foster equitable career growth and enhance workforce inclusivity.
How can HR track diversity metrics using Excel pivot tables for annual reporting?
HR departments can efficiently track diversity metrics using Excel pivot tables by organizing workforce data into categories such as gender, ethnicity, and age groups. Pivot tables allow quick summarization of complex datasets, facilitating year-over-year comparisons of diversity statistics. For annual reporting, creating dynamic pivot tables ensures easy updates and insightful analysis.
What Excel formulas automate gender and ethnicity breakdown in workforce data?
Excel formulas like COUNTIFS and SUMPRODUCT automate the segmentation of gender and ethnicity in workforce datasets. These formulas enable precise counts based on multiple criteria, simplifying demographic breakdowns by department or role. Utilizing these formulas streamlines the preparation of diversity reports, enhancing accuracy and efficiency.
How to visualize EEO-1 report categories in Excel dashboards?
Visualizing EEO-1 report categories in Excel dashboards involves using charts such as stacked bar graphs and pie charts to represent workforce composition clearly. Conditional formatting and slicers enhance interactivity, allowing stakeholders to filter data by category and understand diversity distribution. This approach promotes transparent and accessible diversity reporting.
Which Excel templates streamline diversity hire analysis by department?
Templates designed for diversity hire analysis often include pre-built pivot tables and charts categorized by department, job grade, and hiring dates. These Excel templates accelerate the identification of hiring trends and diversity gaps within specific teams. Using standardized templates ensures consistent data presentation and supports strategic hiring decisions.
What Excel methods flag diversity goal gaps across different job grades?
Excel methods such as conditional formatting combined with calculated columns can highlight discrepancies between actual workforce diversity and established goals within job grades. Using formulas like IF statements and variance calculations allows HR to pinpoint underrepresented groups easily. This proactive approach helps organizations address gaps and meet diversity objectives effectively.
More Human Resource Excel Templates