Monthly Retail Sales Performance Tracker Excel Template
The
Monthly Retail Sales Performance Tracker Excel Template is a comprehensive tool designed to monitor and analyze retail sales data on a monthly basis. It enables businesses to track sales trends, identify top-performing products, and evaluate the effectiveness of marketing strategies with clear visualizations and easy-to-update spreadsheets. Utilizing this template helps retailers make data-driven decisions, optimize inventory, and improve overall sales performance efficiently.
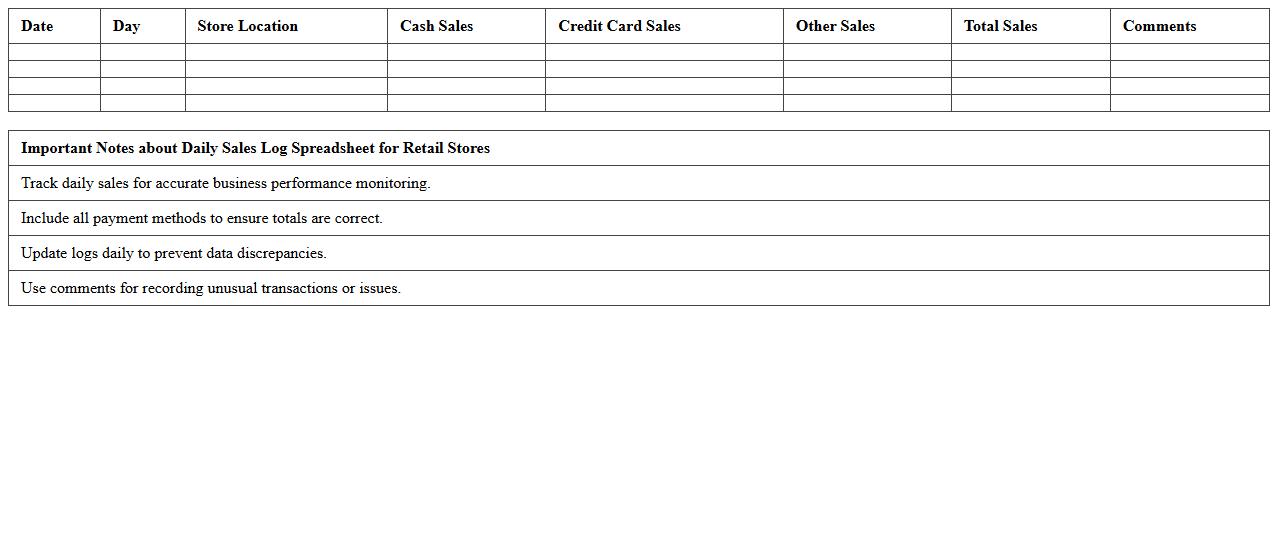
Daily Sales Log Spreadsheet for Retail Stores
A
Daily Sales Log Spreadsheet for Retail Stores is a structured document designed to record and track daily sales transactions, including product details, quantities sold, and revenue generated. This tool enables retail managers to monitor sales performance, identify trends, and manage inventory efficiently. Accurate daily sales logs support informed decision-making, improve financial forecasting, and optimize overall store operations.
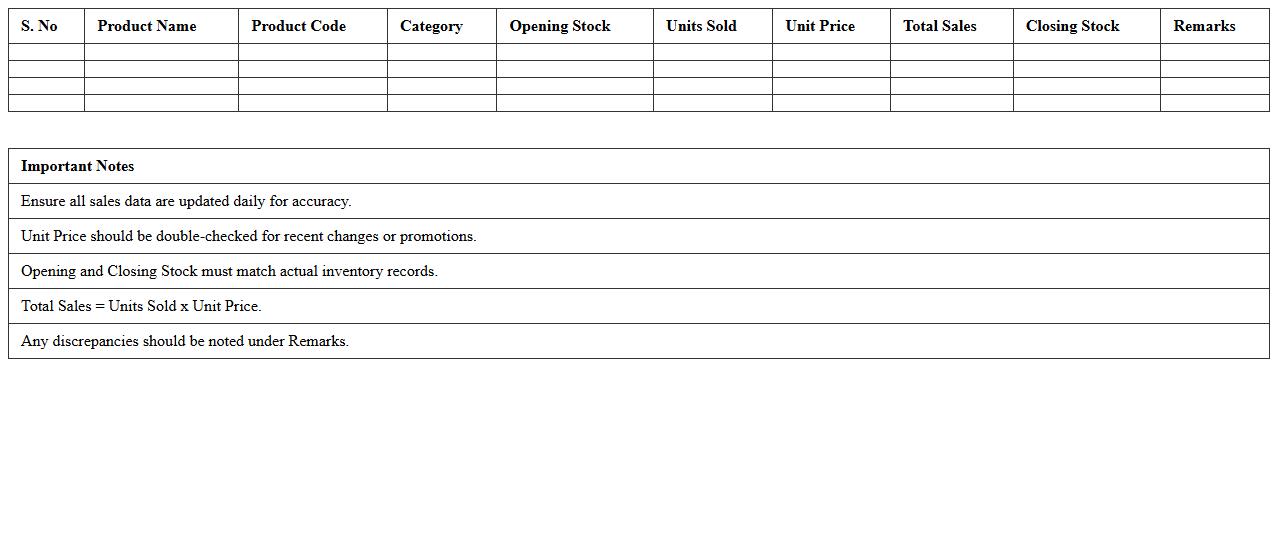
Product-Wise Retail Sales Report Excel Sheet
The
Product-Wise Retail Sales Report Excel Sheet is a detailed document that organizes sales data by individual products, enabling businesses to track performance metrics such as units sold, revenue generated, and sales trends over specific periods. This structured report helps identify top-performing products, optimize inventory management, and support data-driven marketing strategies. Retailers leverage this tool to enhance decision-making, improve forecasting accuracy, and increase overall profitability by focusing on high-demand items.
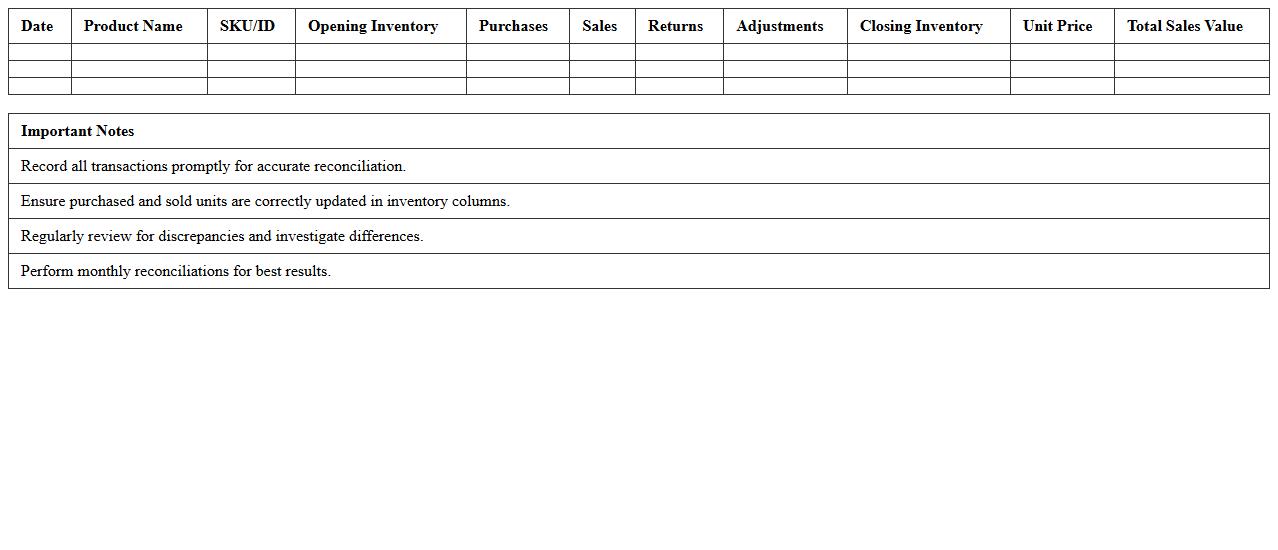
Inventory and Sales Reconciliation Excel Template
The
Inventory and Sales Reconciliation Excel Template is a specialized spreadsheet designed to track and compare inventory levels against sales records, ensuring accuracy in stock management. It helps businesses identify discrepancies between actual inventory and sales data, allowing for timely corrections and improved financial reporting. Utilizing this template optimizes inventory control, reduces stockouts or overstock situations, and enhances overall operational efficiency.
Retail Sales Forecast and Target Tracker Spreadsheet
The
Retail Sales Forecast and Target Tracker Spreadsheet is a powerful tool designed to monitor and predict sales performance over specific periods, enabling businesses to set and track realistic sales targets. By analyzing historical sales data and current market trends, this spreadsheet helps in optimizing inventory management, improving budgeting accuracy, and identifying growth opportunities. It empowers retail managers to make data-driven decisions, enhance sales strategies, and efficiently allocate resources for maximum profitability.
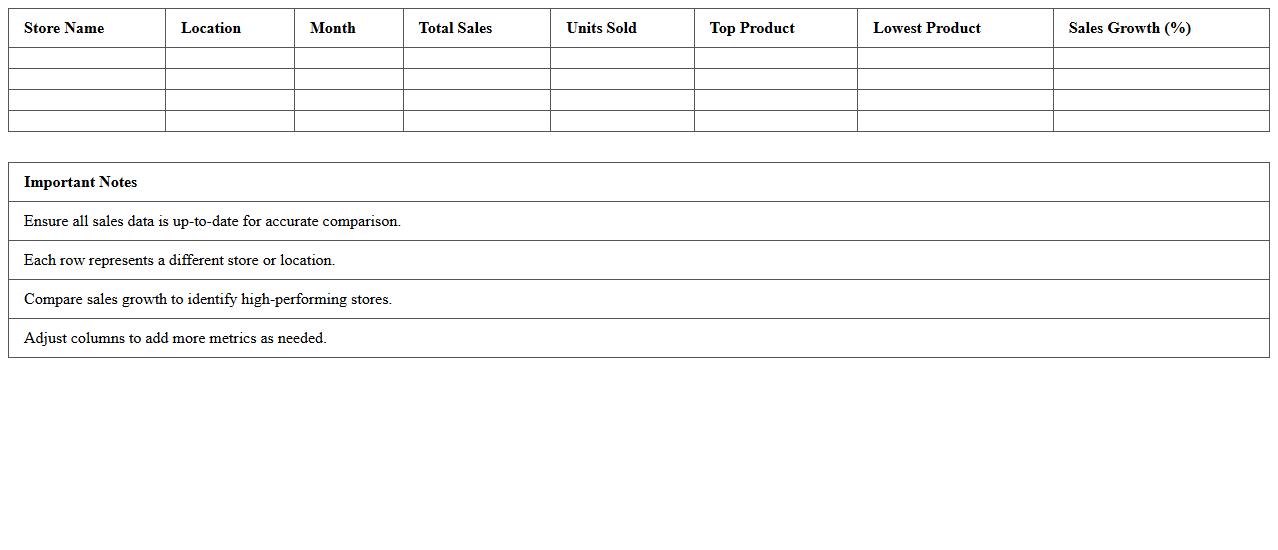
Multi-Store Retail Sales Comparison Excel Template
The
Multi-Store Retail Sales Comparison Excel Template is a comprehensive tool designed to analyze and compare sales performance across multiple retail locations efficiently. It consolidates data from various stores, enabling users to identify trends, track growth, and pinpoint underperforming outlets through visual dashboards and detailed reports. This template streamlines decision-making by providing clear, actionable insights into sales metrics, helping businesses optimize inventory, staffing, and marketing strategies.
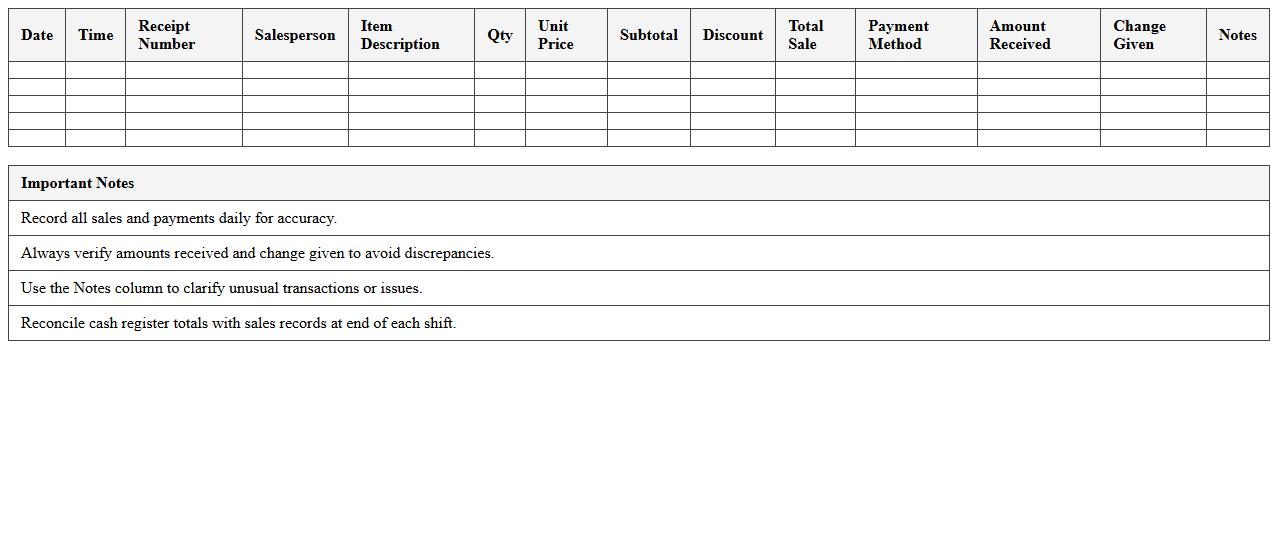
Cash Register Sales and Payment Log Excel Sheet
A
Cash Register Sales and Payment Log Excel Sheet document is a digital tool designed to systematically record daily sales transactions and payments. It helps businesses maintain accurate financial records by tracking cash inflows, sales amounts, and payment types, ensuring transparent and organized bookkeeping. Utilizing this log enhances financial accountability, simplifies auditing processes, and aids in generating detailed sales reports for better business insights.
Sales by Employee Performance Tracker Excel Template
The
Sales by Employee Performance Tracker Excel Template is a customizable spreadsheet designed to monitor and analyze individual sales representatives' productivity and revenue generation. It enables businesses to identify top performers, track sales targets against actual achievements, and uncover areas needing improvement. This tool is essential for enhancing sales strategies, motivating staff through data-driven insights, and optimizing overall team performance.
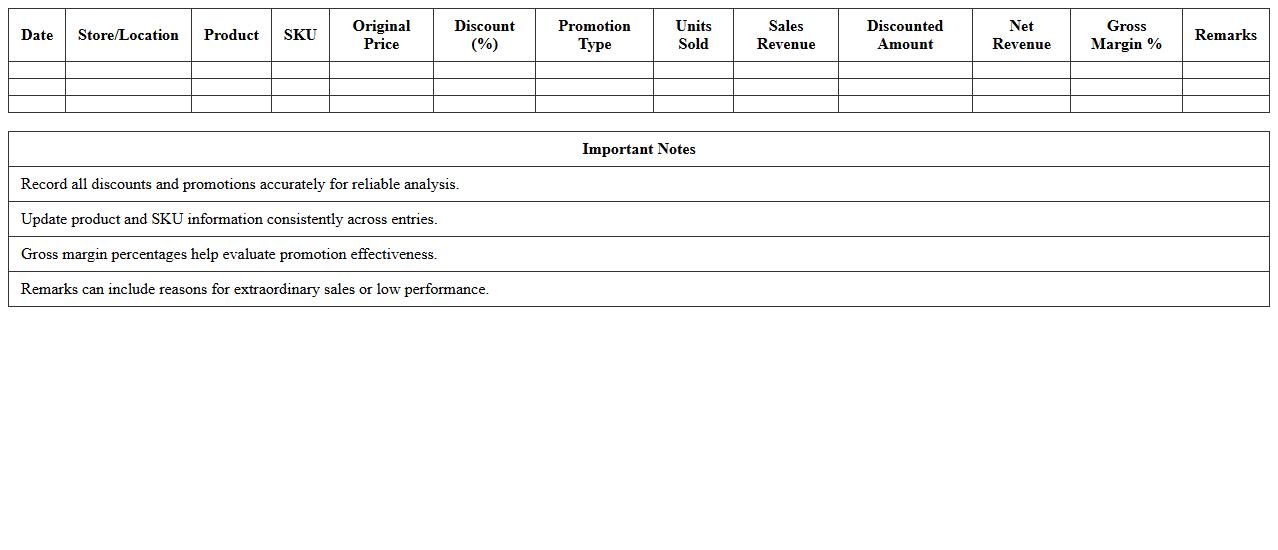
Retail Discount and Promotion Sales Analysis Spreadsheet
A
Retail Discount and Promotion Sales Analysis Spreadsheet is a comprehensive tool designed to track, analyze, and optimize sales performance during discount events and promotional campaigns. It consolidates data such as discount percentages, sales volume, revenue impact, and customer behavior to provide actionable insights for improving marketing strategies. Using this spreadsheet helps retailers identify the most effective promotions, maximize profitability, and make informed decisions about future discount offerings.
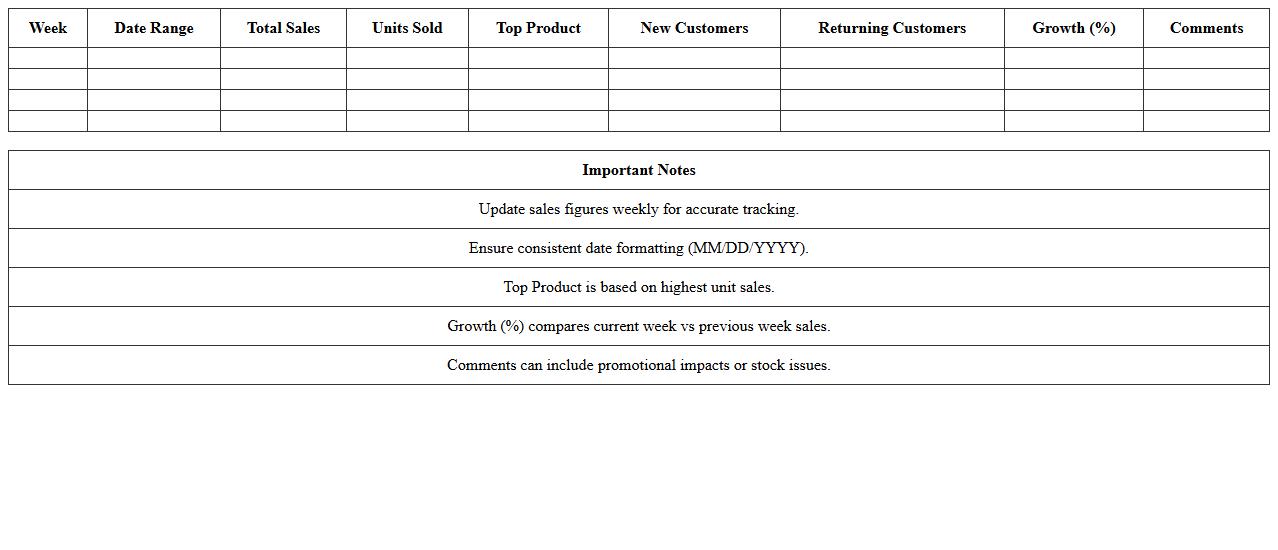
Weekly Sales Summary Dashboard Excel Template
The
Weekly Sales Summary Dashboard Excel Template is a powerful tool designed to track, analyze, and visualize sales data on a weekly basis. It consolidates key metrics such as total sales, product performance, and customer trends into an easy-to-understand dashboard, enabling quick decision-making and effective sales strategy adjustments. By providing real-time insights and automated updates, this template helps businesses optimize operations and boost revenue efficiently.
How can I automate monthly inventory updates in my Retail Sales Tracker Excel?
Automating monthly inventory updates in Excel can be achieved using Excel macros or VBA scripts that update stock levels based on sales data. You can also use Power Query to connect to external databases or CSV files for automatic data refreshes. Setting up scheduled refreshes ensures inventory data stays accurate without manual effort.
What formulas optimize profit margin calculations for each SKU in the tracker?
To calculate profit margin per SKU, use the formula =(Selling Price - Cost Price) / Selling Price. Incorporating conditional formatting helps highlight SKUs with low profit margins for quick review. Utilize Excel's SUMPRODUCT function to analyze weighted profit margins across multiple SKUs efficiently.
How do I integrate barcode scanning with the Retail Sales Tracker Excel sheet?
Integrate barcode scanning by connecting a barcode scanner that inputs directly into your Excel sheet's SKU or product ID column. Use data validation to ensure scanned codes match existing inventory items for accuracy. Combining scanner input with VBA macros can automate stock updates and reduce manual data entry errors.
What are the best data validation rules for preventing duplicate sales entries?
Prevent duplicate sales entries by setting data validation rules using the COUNTIF function to check existing sale IDs before accepting new input. Use drop-down lists for SKU selection and require unique sale transaction numbers. Applying worksheet protection safeguards validation rules from accidental modification.
How do I customize graphical sales reports for seasonal performance analysis?
Customize sales reports by using PivotTables and PivotCharts to dynamically filter data for specific seasons. Apply slicers and timeline filters for quick adjustment of date ranges and product categories. Enhance visualization with conditional formatting and customized chart types to reveal seasonal sales trends effectively.