The Marketing Analytics Excel Template for eCommerce Brands streamlines data tracking and performance measurement by consolidating key marketing metrics into an easy-to-use spreadsheet. This template enables brands to analyze customer behavior, campaign effectiveness, and sales trends, driving informed decision-making. Designed for simplicity and precision, it empowers eCommerce businesses to optimize marketing strategies and maximize ROI efficiently.
ECommerce Marketing Channel Performance Dashboard Excel
An
eCommerce Marketing Channel Performance Dashboard in Excel consolidates data from multiple marketing channels to provide clear visualizations of key performance metrics such as conversion rates, ROI, and customer acquisition costs. This tool enables marketers to quickly identify the most effective channels, optimize budget allocation, and track campaign success in real-time. Using this dashboard enhances decision-making by offering insights into channel performance and driving data-driven marketing strategies.
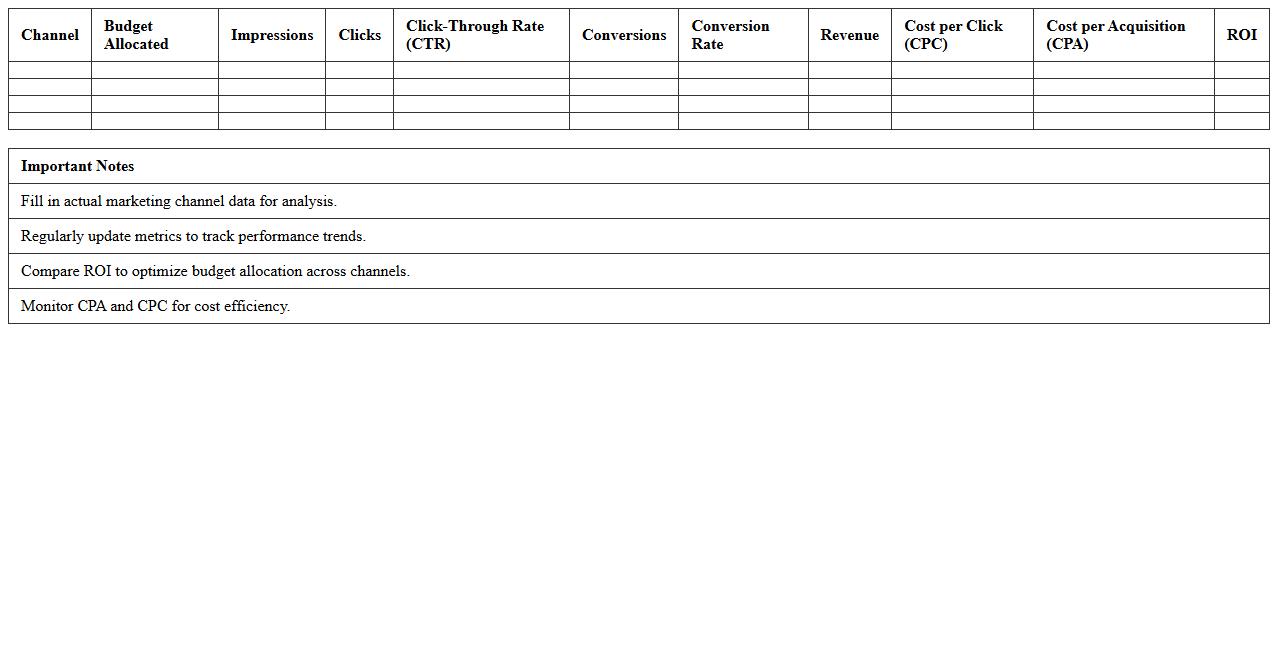
Paid Advertising ROI Tracker for Online Stores
The
Paid Advertising ROI Tracker for Online Stores document systematically measures the return on investment from various paid ad campaigns, providing detailed insights into campaign performance. It helps identify the most profitable channels, optimize ad spending, and increase overall marketing efficiency by tracking key metrics such as cost per acquisition and conversion rates. This data-driven approach enables online retailers to make informed decisions that maximize revenue and minimize wasted advertising budget.
Social Media Campaign Analytics Excel Sheet
A
Social Media Campaign Analytics Excel Sheet is a structured document designed to track, analyze, and visualize key performance metrics from various social media platforms. It helps marketers optimize campaign strategies by providing insights on engagement rates, click-through rates, conversions, and audience demographics in a clear, organized format. Using this tool enables data-driven decision-making to improve ROI and streamline social media marketing efforts efficiently.
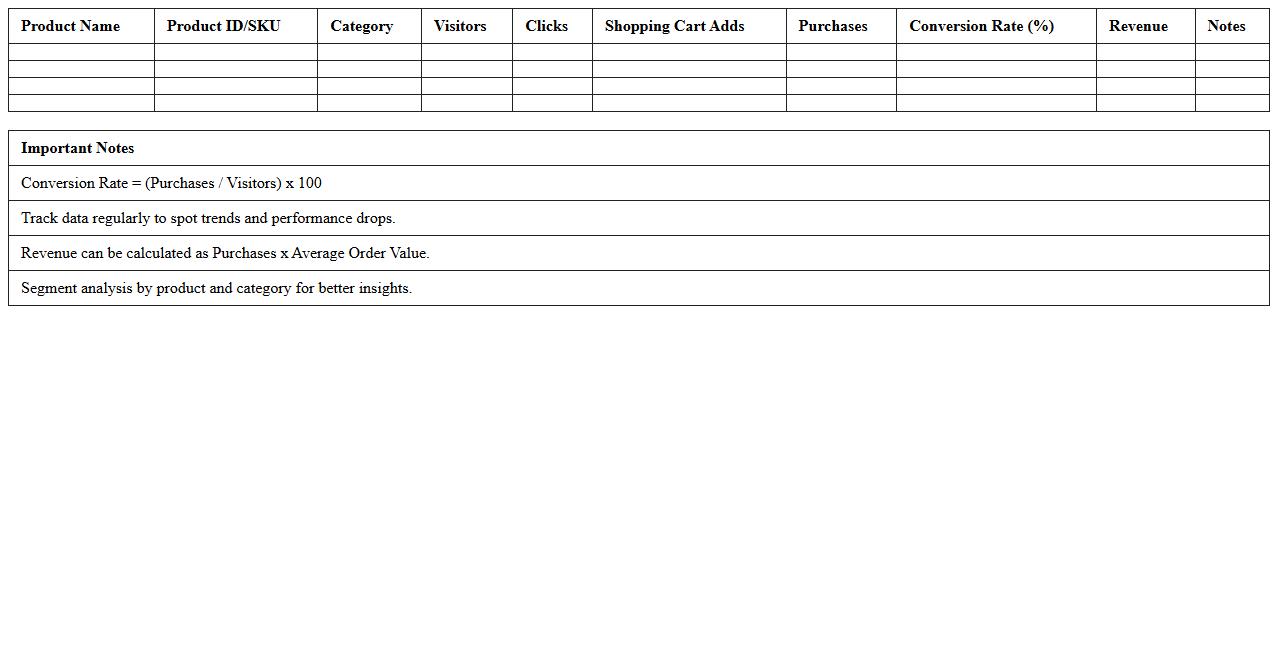
Product Conversion Rate Analysis Spreadsheet
A
Product Conversion Rate Analysis Spreadsheet is a tool designed to track and evaluate the effectiveness of product sales by calculating the percentage of visitors who make a purchase. It helps businesses identify trends, optimize marketing strategies, and improve overall sales performance by highlighting which products convert best. Using this spreadsheet enables data-driven decision-making, leading to increased revenue and more efficient resource allocation.
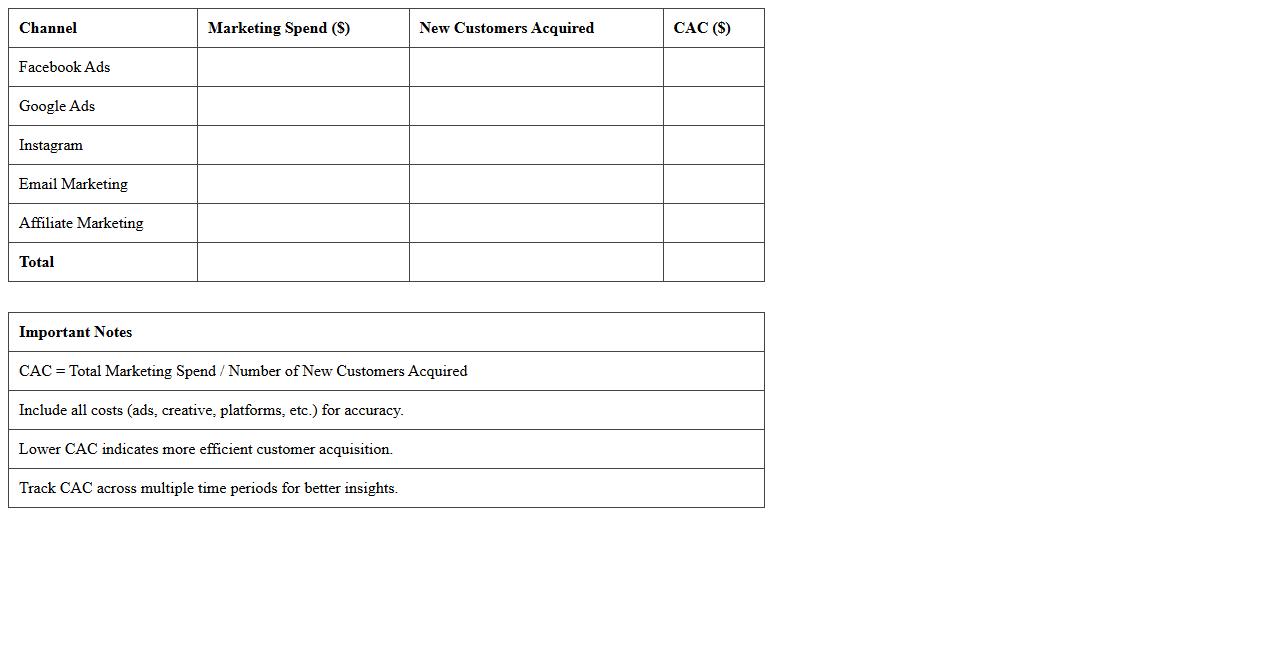
Customer Acquisition Cost Calculator for eCommerce
A
Customer Acquisition Cost Calculator for eCommerce is a tool designed to measure the total expenses involved in attracting a new customer, including marketing, sales, and advertising costs. This document helps businesses optimize their marketing budget by providing precise insights into the efficiency of different acquisition channels and campaigns. By analyzing these costs, eCommerce companies can improve their return on investment, allocate resources more effectively, and strategically grow their customer base.
Email Marketing Metrics Tracker Excel Template
The
Email Marketing Metrics Tracker Excel Template document is designed to systematically record, analyze, and visualize key performance indicators (KPIs) related to email campaigns such as open rates, click-through rates, bounce rates, and conversion rates. It enables marketers to monitor campaign effectiveness, identify trends, and optimize email strategies based on data-driven insights. Using this template improves decision-making efficiency by providing a clear overview of campaign metrics in one organized, easily accessible spreadsheet.
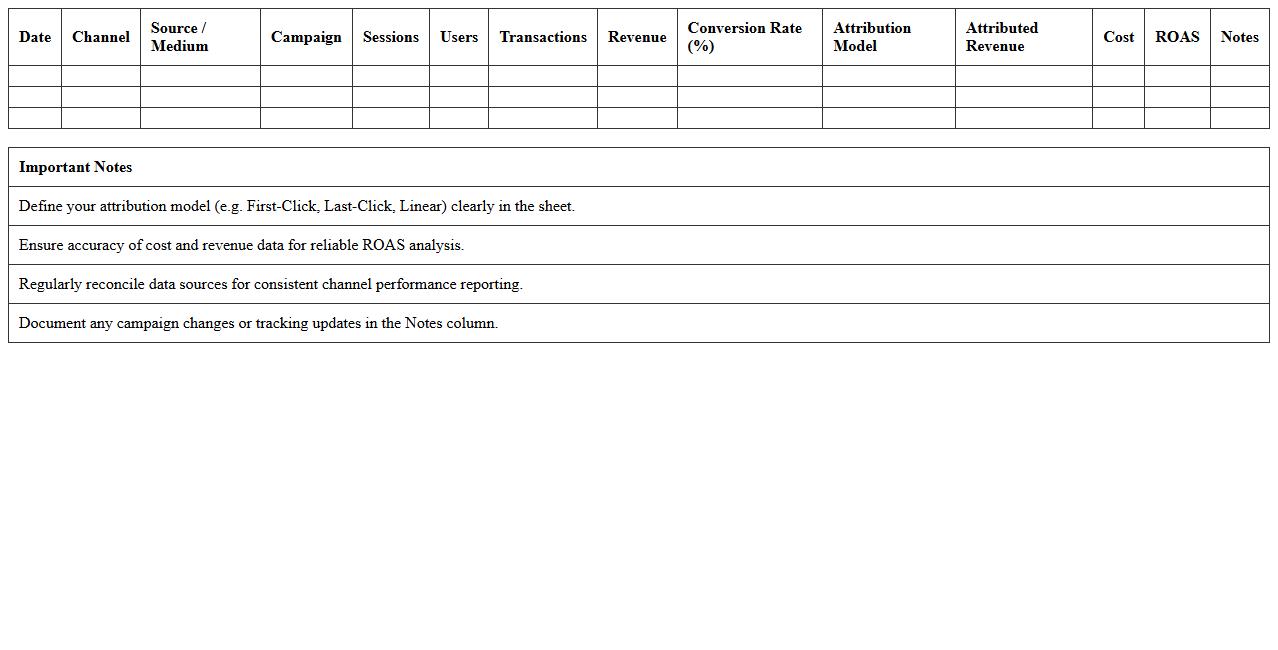
ECommerce Sales and Funnel Attribution Model Sheet
The
eCommerce Sales and Funnel Attribution Model Sheet document is a powerful tool designed to track and analyze the customer journey from initial awareness to final purchase. It helps businesses identify which marketing channels and campaigns contribute most effectively to conversions, enabling informed budget allocation and strategy refinement. By providing clear insights into attribution, this sheet maximizes sales performance and optimizes marketing ROI for eCommerce operations.
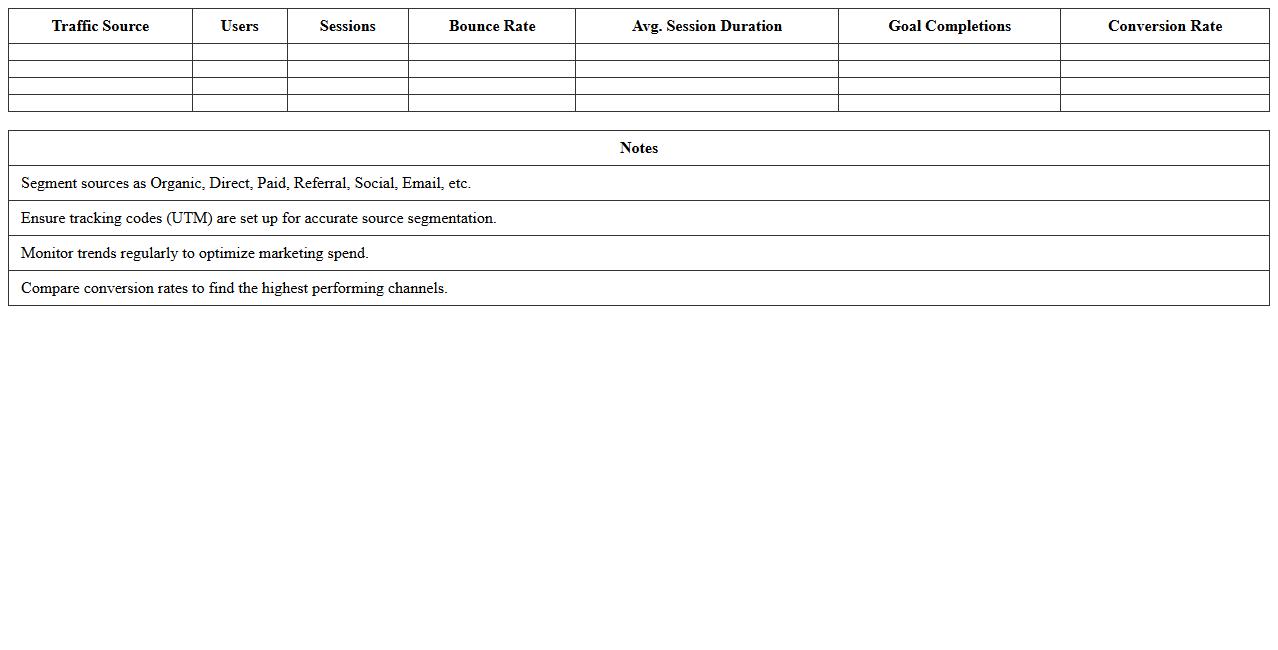
Website Traffic Source Segmentation Dashboard
The
Website Traffic Source Segmentation Dashboard document provides a detailed analysis of where website visitors originate, categorizing traffic into sources like organic search, paid ads, social media, and direct visits. This segmentation helps businesses identify which channels drive the most valuable traffic, enabling targeted marketing strategies and optimized resource allocation. By understanding traffic patterns, companies can improve user engagement, enhance conversion rates, and boost overall website performance.
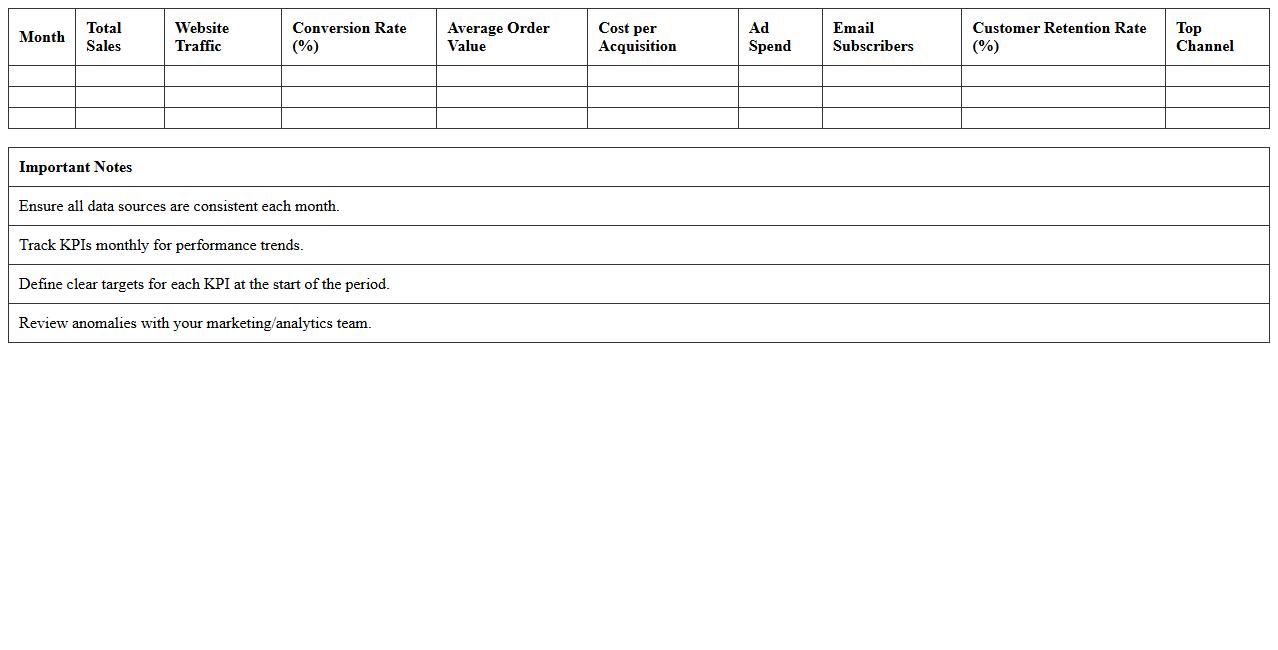
ECommerce Monthly Marketing KPI Report Template
The
eCommerce Monthly Marketing KPI Report Template document systematically tracks key performance indicators such as conversion rates, average order value, customer acquisition cost, and return on ad spend, providing clear insights into marketing effectiveness. By consolidating detailed data analytics, it enables businesses to identify trends, optimize campaigns, and allocate resources strategically. This template is essential for maintaining consistent performance evaluation and driving informed decision-making to enhance overall eCommerce growth.
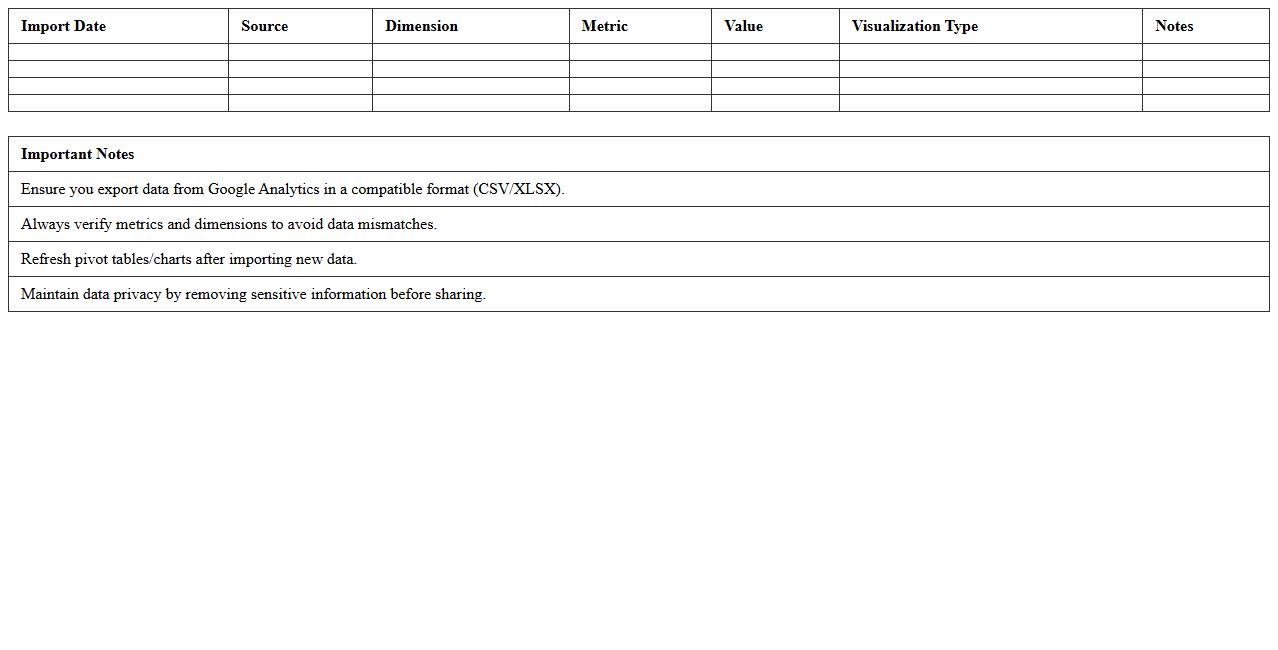
Google Analytics Data Import and Visualization Excel
Google Analytics Data Import and Visualization Excel document is a powerful tool that enables users to integrate external data with Google Analytics metrics for enhanced reporting and analysis. By importing data such as offline transactions or CRM details, businesses gain a comprehensive view of customer behavior and campaign performance within a single framework. This
data integration and visualization capability streamlines decision-making and uncovers actionable insights through customized charts and dashboards.
How can I automate ROAS calculations in Excel for multiple eCommerce campaigns?
To automate ROAS calculations, start by setting up a consistent data template with revenue and ad spend columns. Use Excel formulas like =SUMIFS to aggregate spend and revenue for each campaign automatically. Implement dynamic named ranges or Excel tables to ensure seamless updates as new data is added.
What is the best way to visualize customer lifecycle segments using pivot tables?
Pivot tables provide a powerful method for visualizing customer lifecycle segments by grouping data based on customer activities or time periods. Use slicers and filters within the pivot table to segment customers by key lifecycle stages such as acquisition, active, and dormant. Complement pivot tables with charts like stacked bar or funnel charts to enhance the segmentation analysis visually.
How do I track and analyze cart abandonment trends with Excel formulas?
Excel formulas like =COUNTIFS and =SUMIFS can track cart abandonment by calculating totals for initiated vs. completed transactions. Create a calculated abandonment rate by dividing the number of abandoned carts by total carts initiated. Utilize conditional formatting to highlight days or campaigns with unusually high abandonment rates for quick trend identification.
Which Excel functions help monitor cross-channel attribution for eCommerce sales?
Key Excel functions for monitoring cross-channel attribution include =VLOOKUP, =INDEX paired with =MATCH, and =SUMPRODUCT to aggregate sales data across channels. These functions enable matching sales and marketing data to channels and calculating weighted contributions. Combining these with pivot tables offers comprehensive insight into attribution performance.
What advanced filtering techniques identify top-performing products by conversion rate?
Advanced filtering techniques in Excel, such as applying multi-level filters or using the =FILTER function in Excel 365, help isolate top products by conversion rate efficiently. Sort and filter your data by conversion rate metrics to highlight products exceeding specific thresholds. Additionally, integrating helper columns to calculate conversion rates streamlines the analysis process.
More Marketing Excel Templates