The Logistics KPI Excel Template for Performance Monitoring is designed to track and analyze key performance indicators essential for efficient supply chain management. This template enables logistics managers to visualize data trends, measure delivery times, and optimize inventory control, ensuring better decision-making. Its user-friendly format supports real-time updates and customizable metrics tailored to specific organizational goals.
Warehouse Inventory Turnover KPI Tracker Excel
The
Warehouse Inventory Turnover KPI Tracker Excel is a tool designed to monitor and analyze the rate at which inventory is sold and replaced within a warehouse. This tracker helps businesses optimize stock levels, reduce holding costs, and improve cash flow by providing clear insights into inventory efficiency. Utilizing this Excel document enables timely decision-making regarding reorder points, excess stock, and inventory demand forecasting.
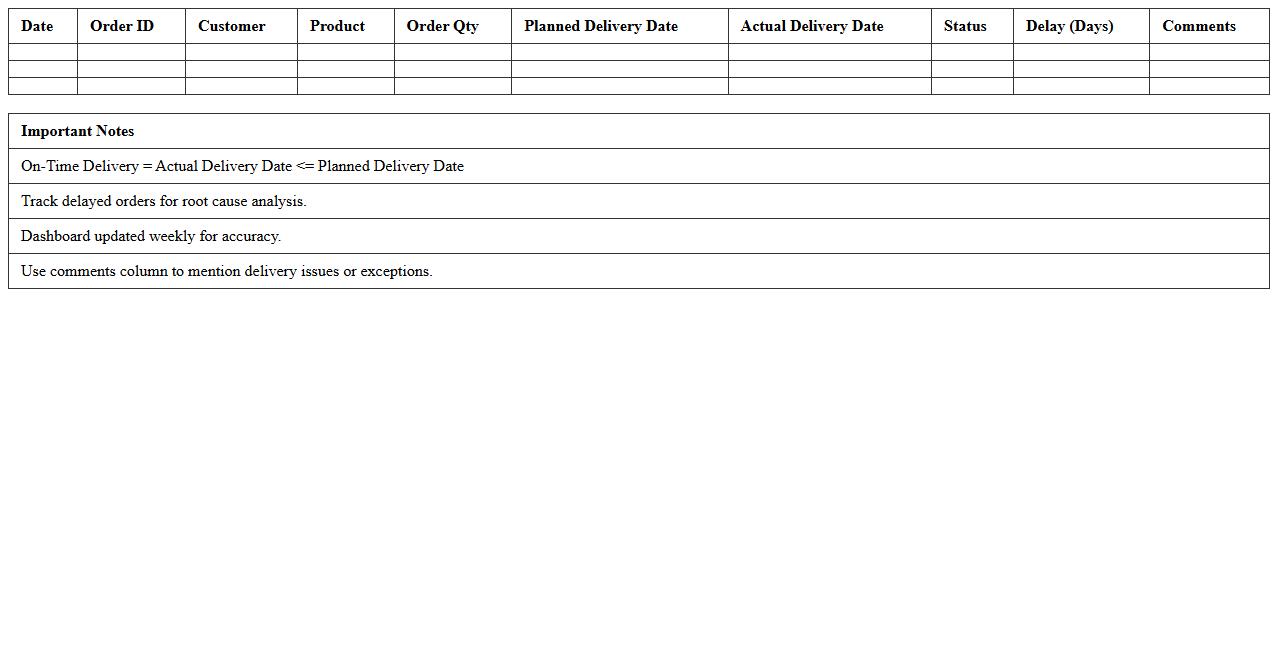
On-Time Delivery Performance Dashboard Excel
The
On-Time Delivery Performance Dashboard Excel document is a powerful tool that tracks and visualizes delivery timelines, ensuring shipments arrive as scheduled. It helps businesses monitor key metrics such as delivery rates, delays, and fulfillment accuracy, enabling data-driven decision-making to improve supply chain efficiency. Using this dashboard enhances operational transparency and supports timely corrective actions to meet customer expectations consistently.
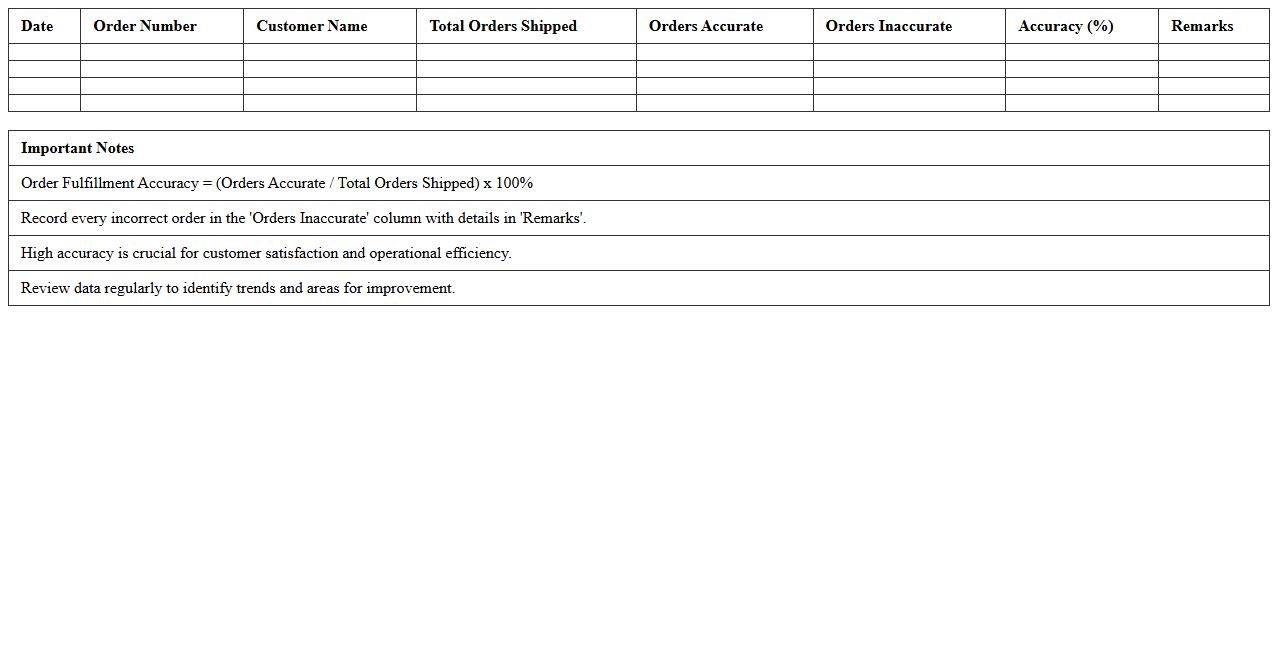
Order Fulfillment Accuracy KPI Sheet
The
Order Fulfillment Accuracy KPI Sheet document tracks the precision of order processing by measuring the percentage of orders correctly picked, packed, and shipped without errors. It is useful for identifying discrepancies in fulfillment processes, reducing shipping mistakes, and enhancing customer satisfaction. By monitoring this KPI, businesses can streamline operations, improve inventory management, and drive continuous improvement in supply chain efficiency.
Transportation Cost Analysis KPI Excel
The
Transportation Cost Analysis KPI Excel document is a powerful tool designed to track, measure, and analyze transportation expenses across different routes and modes of shipment. It enables businesses to identify cost-saving opportunities by visualizing key performance indicators such as fuel consumption, delivery times, and vehicle utilization. This data-driven approach helps optimize logistics operations, reduce overhead, and improve overall supply chain efficiency.
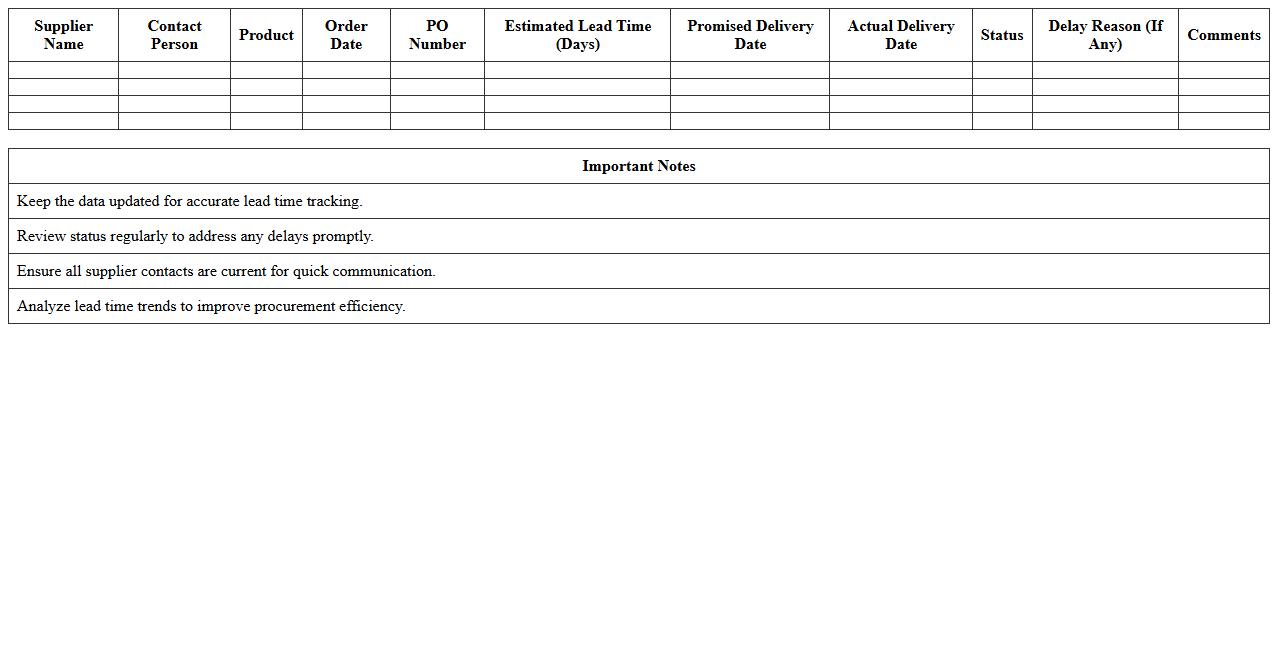
Supplier Lead Time Monitoring Spreadsheet
A
Supplier Lead Time Monitoring Spreadsheet document tracks the duration between order placement and delivery from suppliers, enabling businesses to manage procurement timelines effectively. It helps identify delays, optimize inventory levels, and improve supply chain efficiency by providing clear insights into supplier performance. This tool supports better decision-making and ensures timely production schedules by reducing the risk of stockouts or overstock situations.
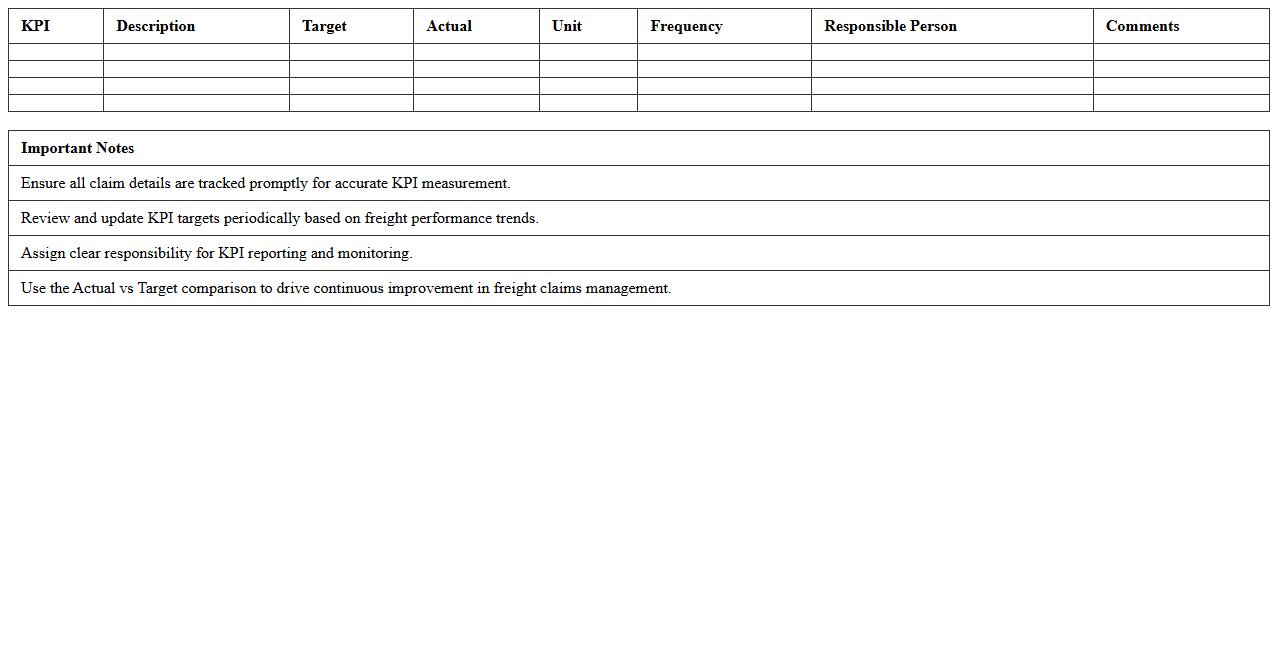
Freight Claims Management KPI Template
The
Freight Claims Management KPI Template document is a structured tool designed to track and measure key performance indicators related to freight claims processing, such as claim resolution time, claim accuracy, and financial recovery rate. Utilizing this template helps logistics and supply chain teams identify inefficiencies, monitor progress, and ensure timely resolution of freight claims, ultimately reducing costs and improving customer satisfaction. This data-driven approach enables organizations to optimize claims management workflows and enhance operational transparency.
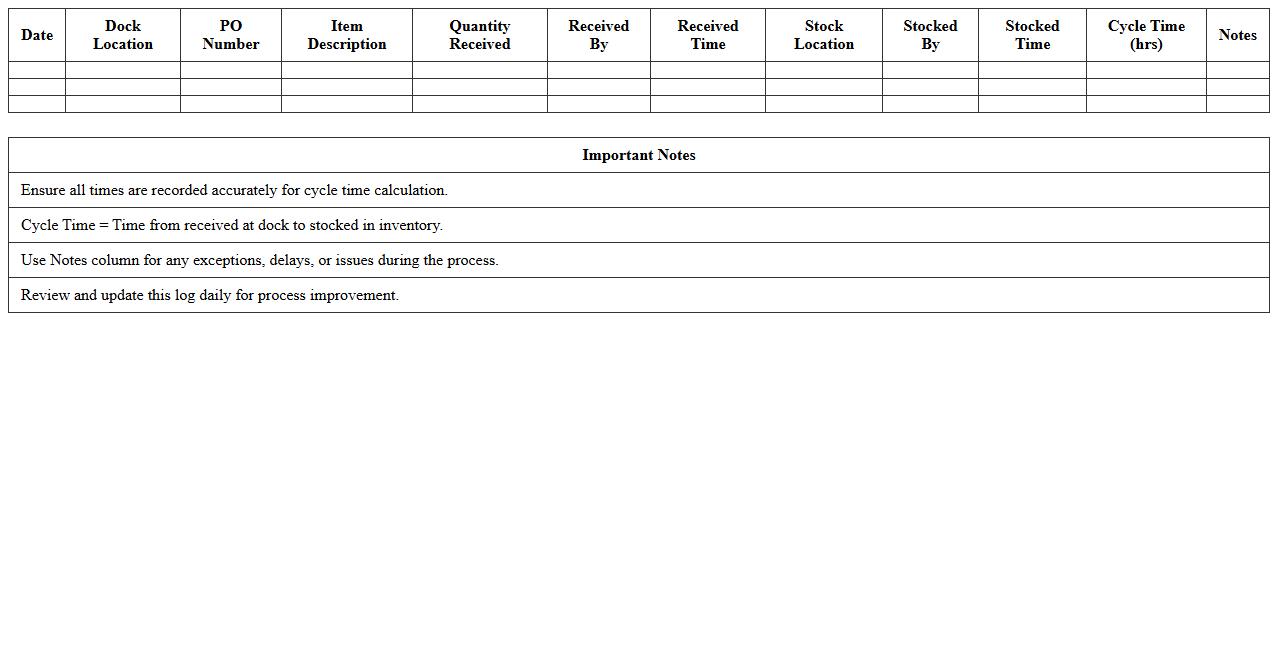
Dock-to-Stock Cycle Time Excel Log
The
Dock-to-Stock Cycle Time Excel Log document tracks the time taken from receiving goods at the dock to storing them in inventory, providing precise measurements of operational efficiency. This log enables supply chain managers to identify bottlenecks, optimize warehouse processes, and improve order fulfillment speed. Accurate cycle time data supports informed decision-making, leading to reduced lead times and enhanced inventory management.
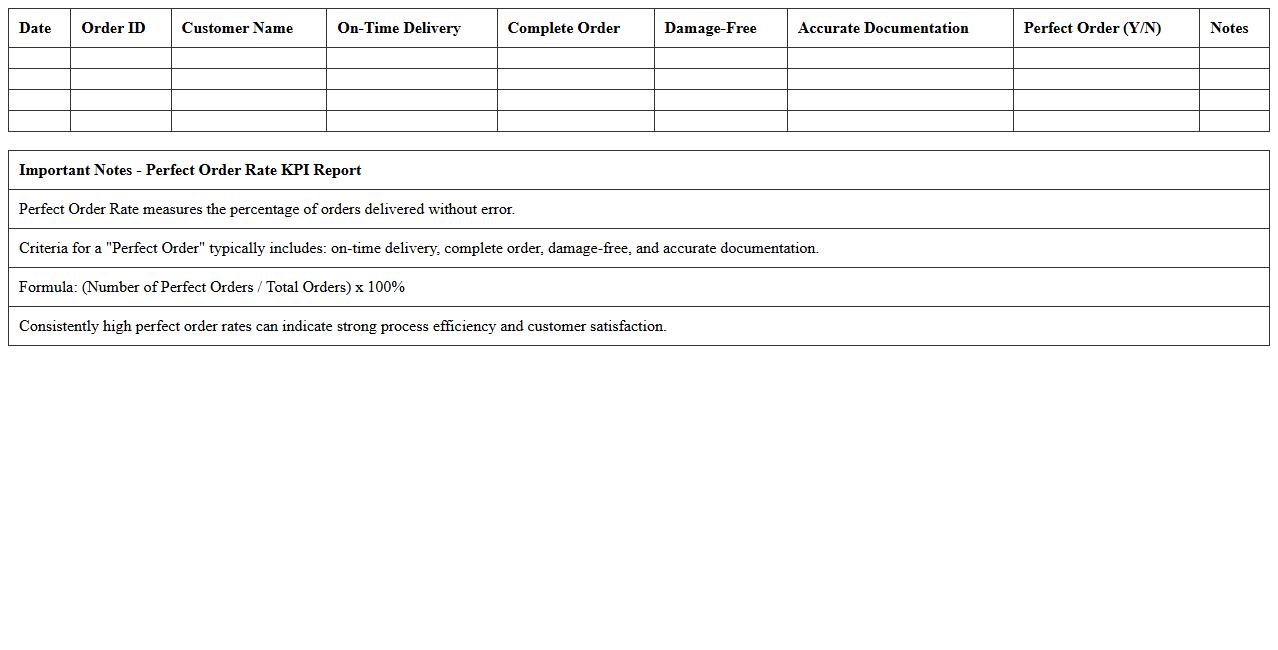
Perfect Order Rate KPI Report Excel
The
Perfect Order Rate KPI Report Excel document tracks the percentage of orders delivered without errors such as delays, damages, or incorrect items. This metric is crucial for measuring supply chain efficiency and customer satisfaction by identifying areas needing improvement. Utilizing this report helps businesses optimize order fulfillment processes and enhance overall operational performance.
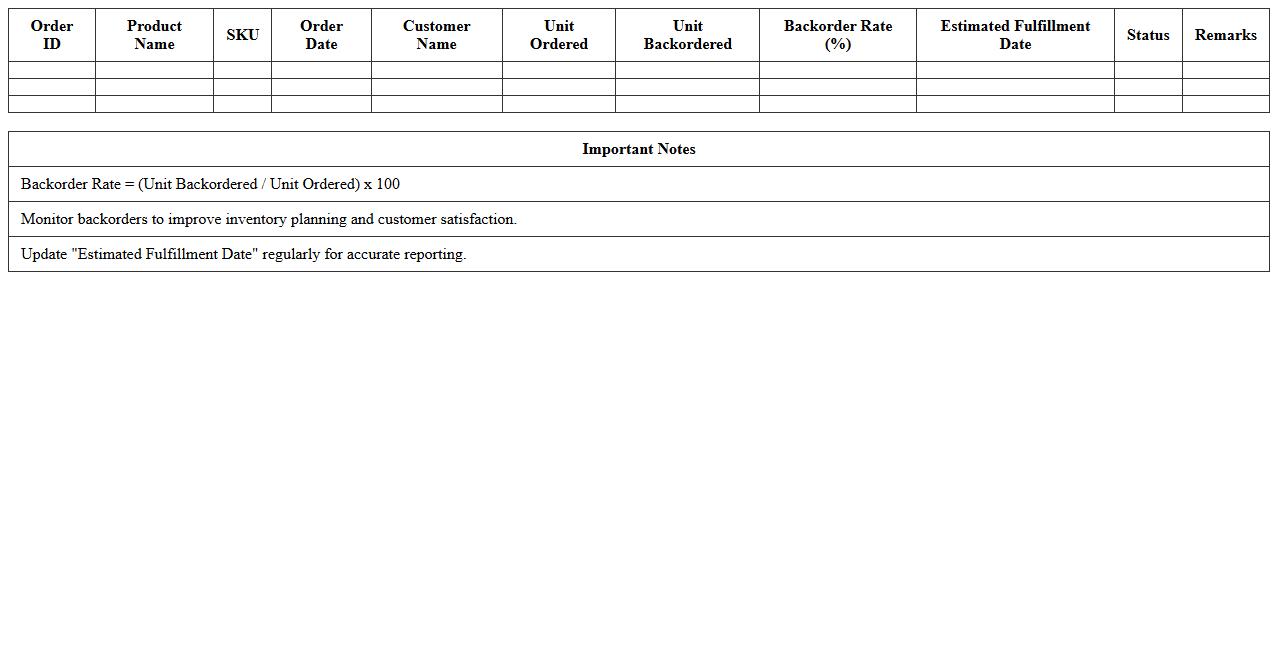
Backorder Rate Monitoring Template
The
Backorder Rate Monitoring Template is a strategic tool designed to track and analyze the frequency of backorders within a supply chain, helping businesses identify patterns and bottlenecks in inventory management. By systematically monitoring backorder rates, organizations can improve demand forecasting accuracy and optimize stock levels, reducing lost sales and enhancing customer satisfaction. This template provides actionable insights that support proactive decision-making to maintain steady product availability and operational efficiency.
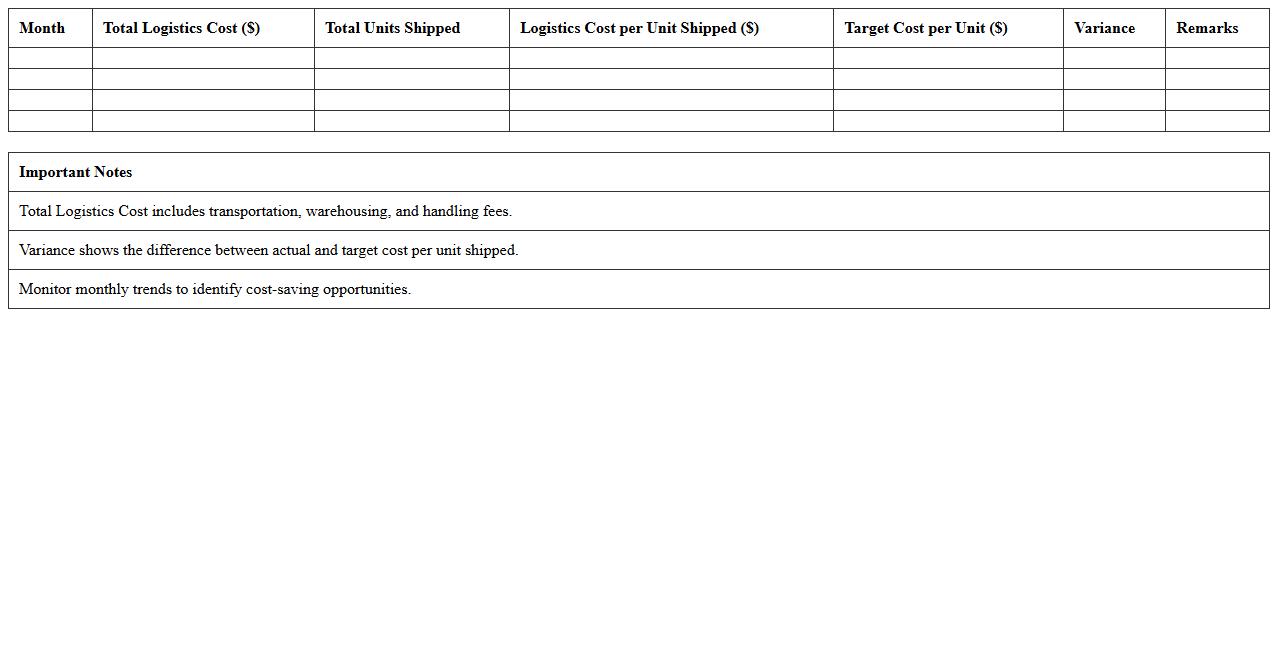
Logistics Cost per Unit Shipped KPI Sheet
The
Logistics Cost per Unit Shipped KPI Sheet is a document that tracks the total logistics expenses divided by the number of units shipped, providing a clear metric for assessing shipping efficiency. This KPI helps businesses identify cost-saving opportunities by analyzing transportation, warehousing, and handling costs on a per-unit basis. Using this sheet enables more informed decision-making to optimize supply chain operations and improve overall profitability.
How can logistics KPI data be auto-updated in Excel for real-time performance tracking?
To auto-update logistics KPI data, integrate Excel with live data sources via Power Query or external APIs. Using Excel's Data Connection feature ensures continuous updates without manual input. Setting automatic refresh intervals helps maintain real-time performance tracking efficiently.
Which advanced Excel formulas best correlate delivery time and shipment accuracy KPIs?
The CORREL function measures the correlation between delivery time and shipment accuracy KPIs effectively. Combining INDEX and MATCH functions allows dynamic KPI comparisons. Additionally, using ARRAY FORMULAS enhances analysis by calculating multiple KPI relationships simultaneously.
What are effective methods to visualize route optimization metrics in a logistics KPI dashboard?
Utilize Excel charts like line charts and scatter plots to display route optimization trends clearly. Employ conditional formatting with color scales to emphasize areas with route delays or inefficiencies. Advanced integration with Power BI can further enhance visualization of complex geographic metrics.
How can conditional formatting highlight underperforming carriers in Excel logistics reports?
Apply conditional formatting rules to metrics such as on-time delivery rates to visually highlight underperforming carriers. Use color-coded icons or data bars to make performance disparities instantly recognizable. Setting thresholds for carrier KPIs allows quick identification of issues in logistics reports.
What pivot table structures best summarize warehouse efficiency KPIs by location and period?
Create pivot tables with location fields as row labels and time periods as column labels for structured analysis. Aggregate KPIs like inventory turnover and order processing time in the values area for comprehensive summaries. Incorporating filter fields enables dynamic comparisons across different warehouses and time frames.
More Logistics Excel Templates