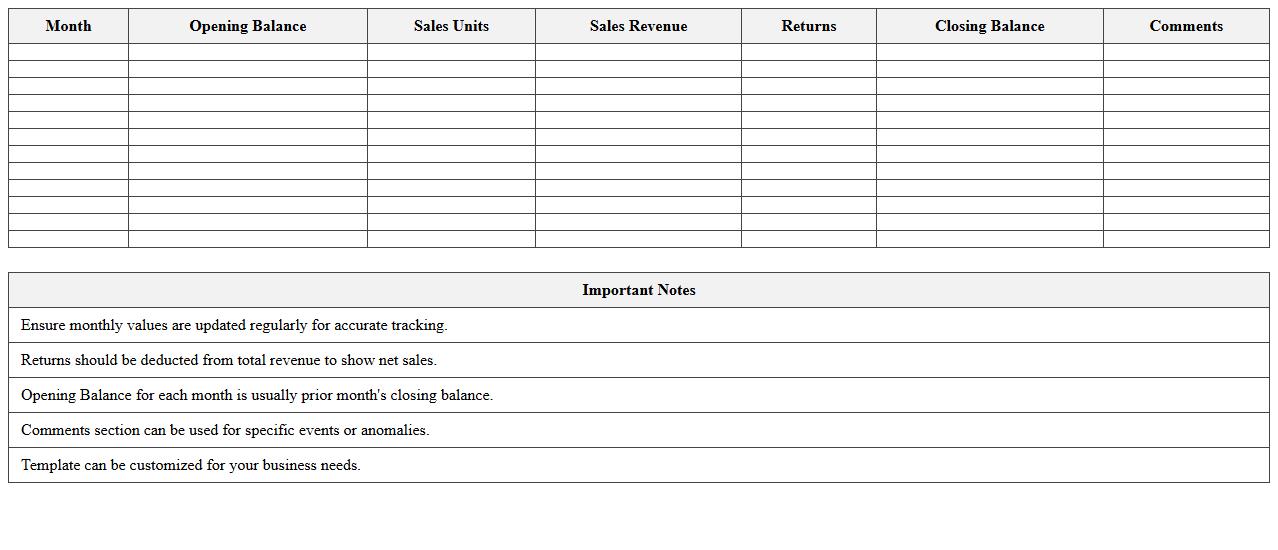
Monthly Sales and Revenue Statement Excel Template
The
Monthly Sales and Revenue Statement Excel Template is a practical document designed to track and analyze business sales and revenue data on a monthly basis. It helps organizations monitor their financial performance, identify sales trends, and make informed decisions to enhance profitability. By automating calculations and providing clear visual summaries, this template streamlines financial reporting and improves budget planning efficiency.
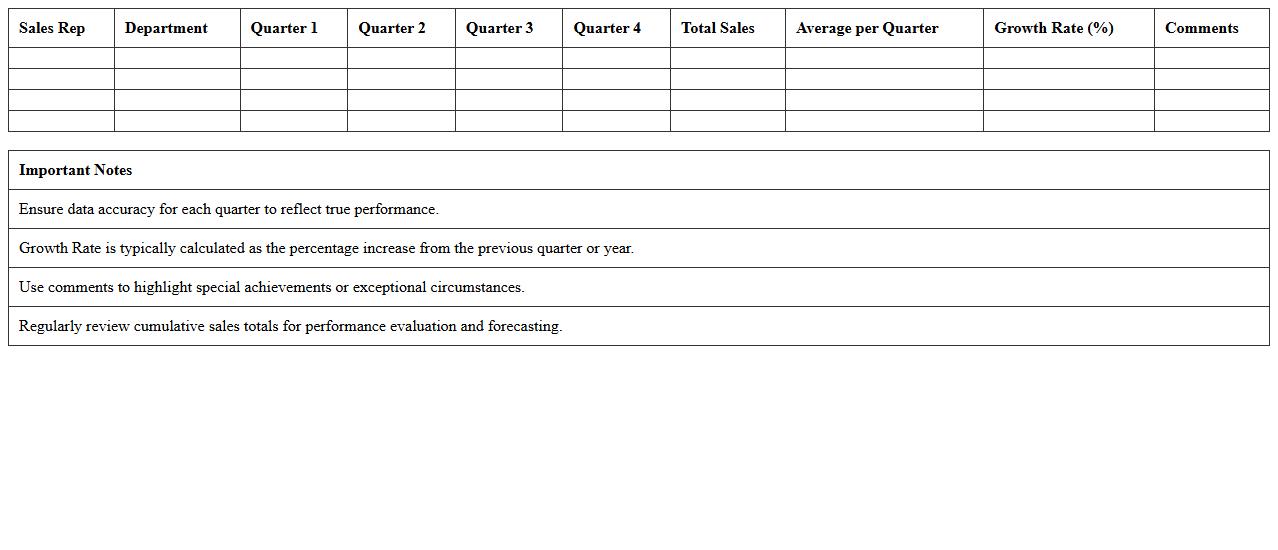
Quarterly Sales Performance Analysis Spreadsheet
A
Quarterly Sales Performance Analysis Spreadsheet is a structured document designed to track, measure, and evaluate sales data over a three-month period, helping businesses identify trends, performance gaps, and growth opportunities. It enables sales teams and management to make informed decisions based on accurate revenue figures, product performance, and market responses. By consolidating data into clear charts and tables, this tool enhances strategic planning, forecasting, and resource allocation for improved business outcomes.
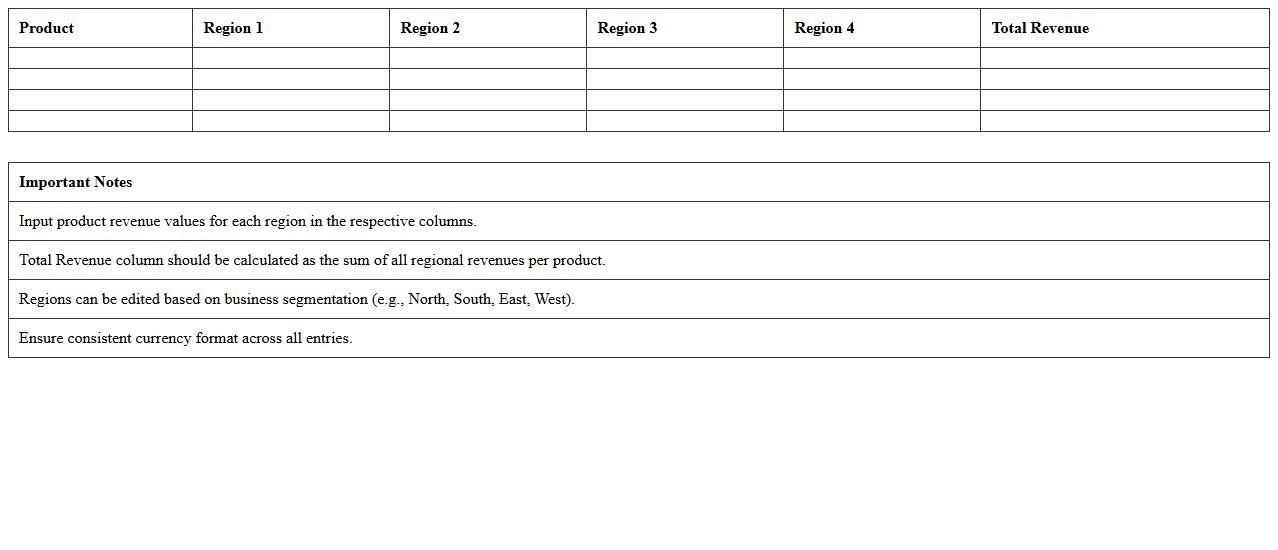
Product Revenue by Region Excel Workbook
The
Product Revenue by Region Excel Workbook document organizes sales data by geographic regions, enabling businesses to analyze revenue performance across diverse markets. It provides detailed charts and pivot tables that highlight regional trends, helping identify high-performing areas and opportunities for growth. This workbook is essential for making data-driven decisions in marketing strategies, resource allocation, and sales forecasting.
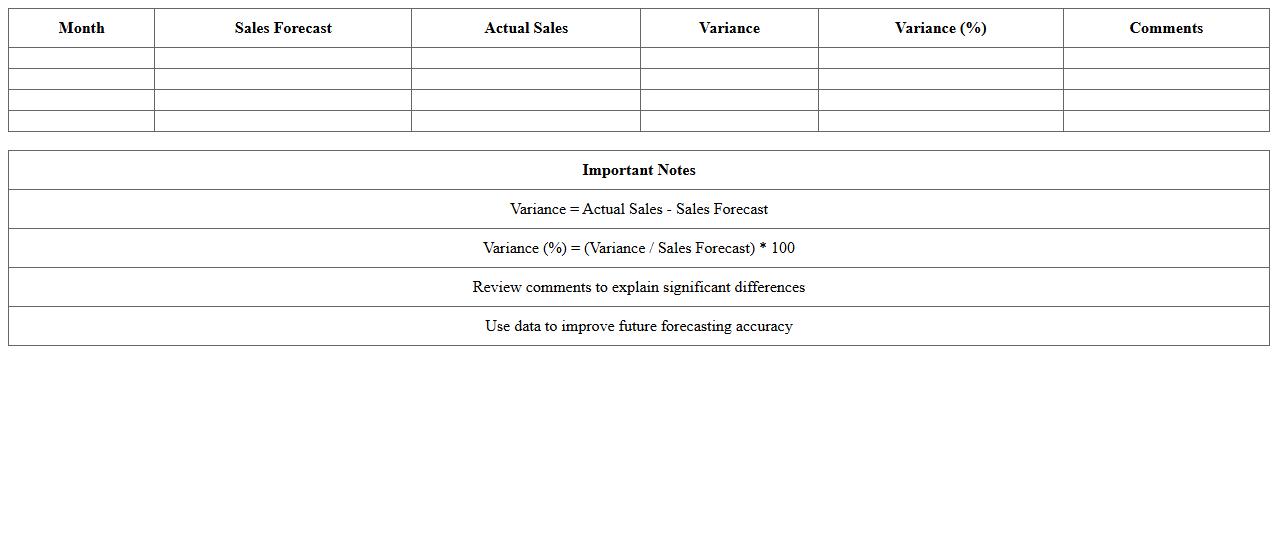
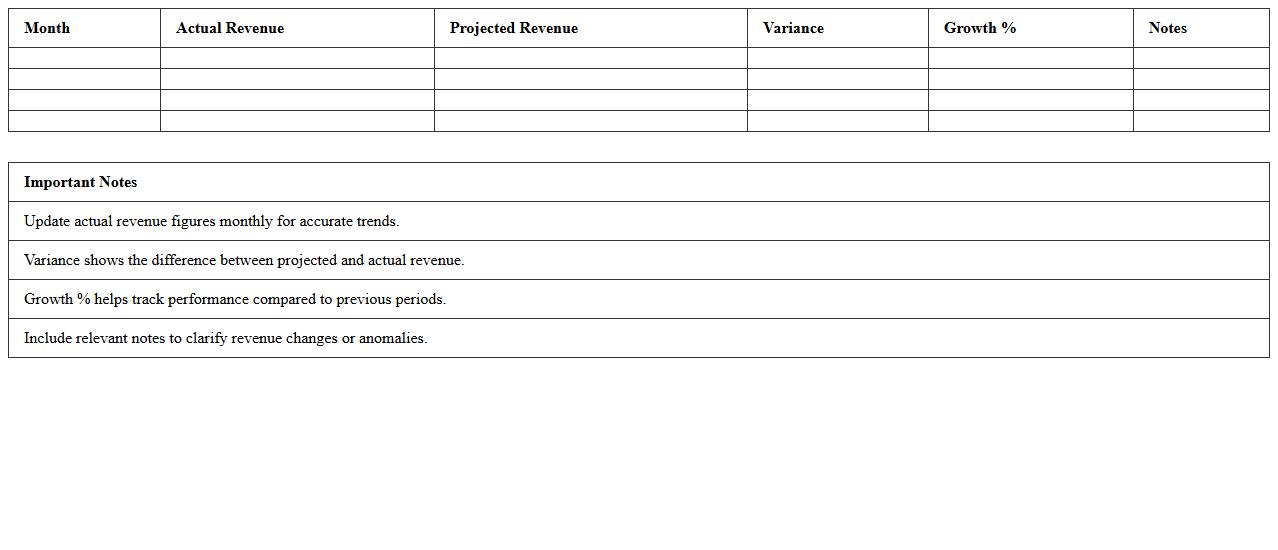
Sales Forecast and Actual Comparison Template
A
Sales Forecast and Actual Comparison Template document systematically tracks projected sales against real sales outcomes, enabling precise performance analysis. This tool helps businesses identify discrepancies, adjust strategies, and improve accuracy in future sales predictions. By regularly comparing forecasted and actual data, companies can optimize inventory management, budget planning, and resource allocation for better financial control.
Customer Sales Tracking and Analysis Sheet
A
Customer Sales Tracking and Analysis Sheet is a detailed document used to record, monitor, and analyze sales data related to individual customers. It helps businesses identify buying patterns, track sales performance, and manage customer relationships effectively. By providing insights into customer behavior and sales trends, this sheet enables data-driven decision-making to enhance marketing strategies and improve revenue growth.
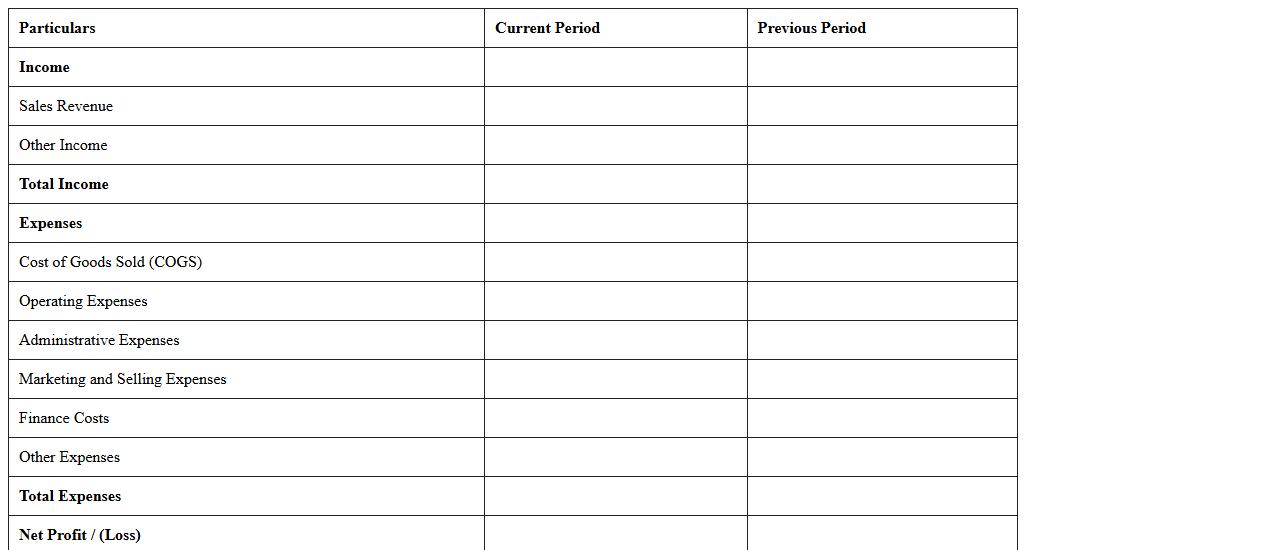
Profit and Loss Statement for Sales Excel
A
Profit and Loss Statement for Sales Excel document is a financial report that summarizes revenues, costs, and expenses incurred during a specific period, providing a clear view of a business's sales performance. It helps businesses track profitability, identify cost-saving opportunities, and make informed decisions by analyzing sales trends and margins. Using this document ensures accurate financial management and supports strategic planning to enhance overall sales effectiveness.
Revenue Trend Dashboard Excel Template
The
Revenue Trend Dashboard Excel Template document provides a dynamic and visual representation of an organization's revenue patterns over time, enabling users to track, analyze, and forecast income streams effectively. By consolidating key financial metrics into interactive charts and graphs, this tool facilitates quick identification of upward or downward trends, seasonal fluctuations, and potential growth opportunities. Utilizing this template enhances data-driven decision-making by offering clear insights into revenue performance, aiding in strategic planning and resource allocation.
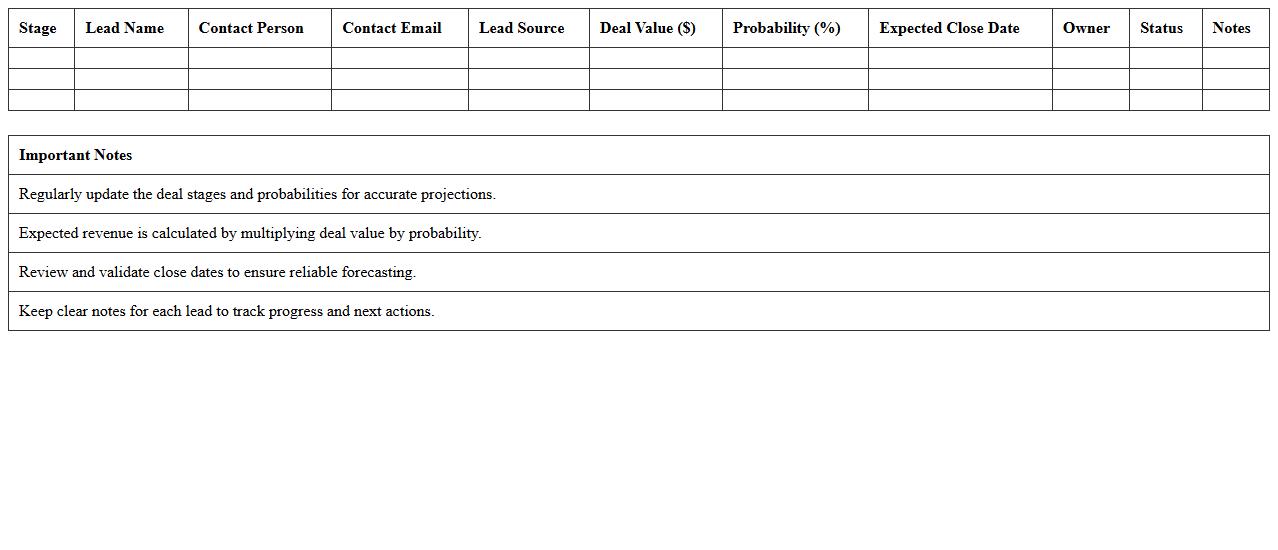
Sales Pipeline and Revenue Projection Excel
A
Sales Pipeline and Revenue Projection Excel document is a powerful tool designed to track potential sales opportunities and forecast future income based on current sales data. It organizes leads, stages of customer engagement, and estimated deal values to provide clear visibility into the sales process and expected revenue streams. This document enables businesses to make data-driven decisions, optimize sales strategies, and accurately predict financial performance for better resource allocation and growth planning.
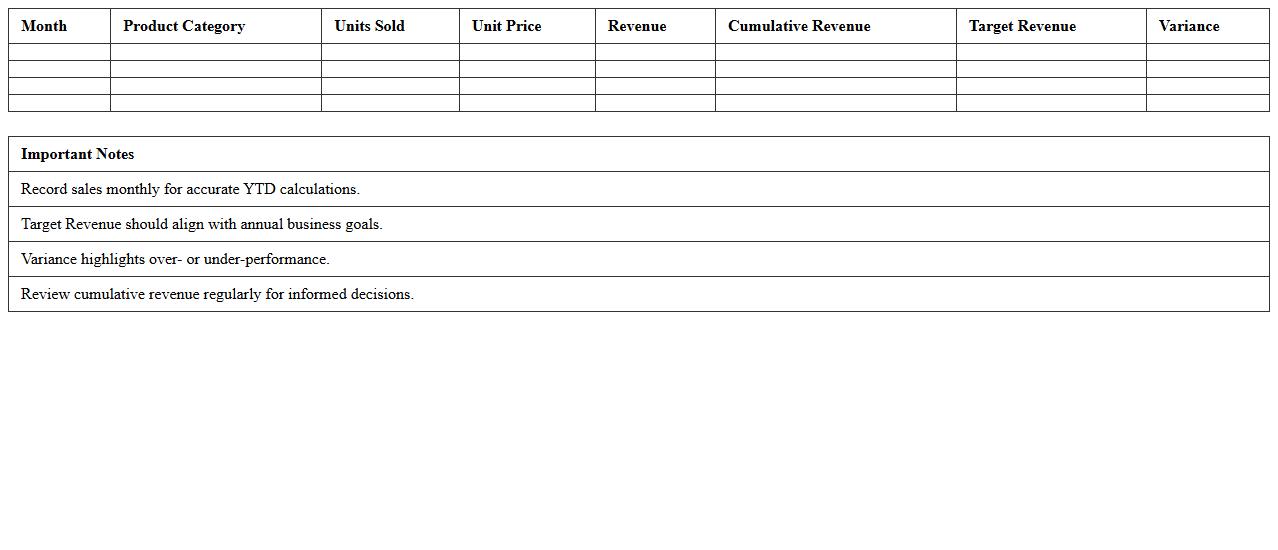
Year-to-Date Sales Revenue Summary Sheet
A
Year-to-Date Sales Revenue Summary Sheet is a comprehensive document that consolidates sales data from the beginning of the fiscal year up to the current date, providing a clear overview of total revenue generated over this period. This sheet is useful for tracking sales performance trends, comparing actual revenue against targets, and identifying seasonal fluctuations or growth opportunities. Businesses leverage this summary to make informed decisions on budgeting, forecasting, and strategic planning.
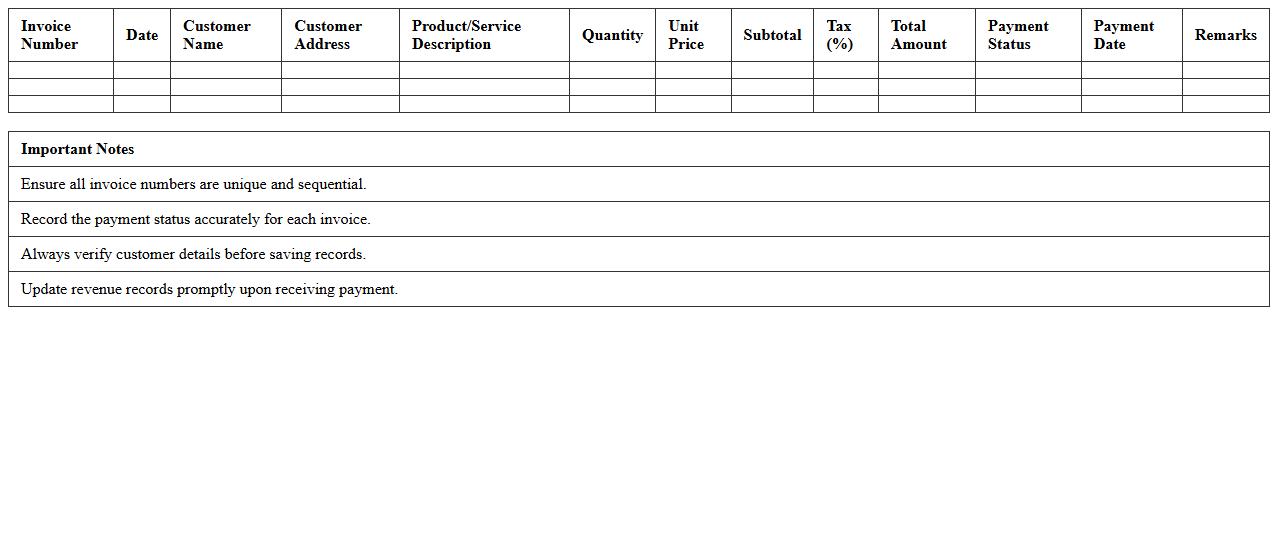
Sales Invoice and Revenue Recording Template
A
Sales Invoice and Revenue Recording Template document is a structured tool designed to systematically capture sales transactions and accurately record generated revenue. It helps businesses maintain precise financial records by detailing customer information, product or service descriptions, quantities, prices, taxes, and total amounts due. Utilizing this template ensures consistent documentation, simplifies accounting processes, and enhances revenue tracking for financial analysis and reporting.
How do I automate monthly sales variance reports using Excel formulas in accounting documentation?
To automate monthly sales variance reports, use Excel formulas such as SUMIFS and IFERROR for dynamic calculations. Implement a model where actual sales are compared against budget or forecast data using variance percentage formulas. Automating this process helps streamline accounting documentation and ensures timely insights.
What Excel functions best track and reconcile revenue discrepancies in sales invoices?
The most efficient Excel functions to track revenue discrepancies include VLOOKUP, MATCH, and IFERROR for cross-referencing invoices. Use SUMPRODUCT for conditional summing to spot differences between expected and actual amounts. These functions enhance revenue reconciliation accuracy in sales invoice management.
How can I use pivot tables to segment sales revenue by product category in accounting statements?
Pivot tables allow easy segmentation of sales data by product category through drag-and-drop fields. Group categories in the row section and sum sales revenue in the values area for a clear breakdown. This technique simplifies analysis and improves the clarity of accounting statements.
What are the most effective Excel templates for documenting deferred revenue in sales accounting?
Effective Excel templates for deferred revenue include schedules that separate earned versus deferred amounts using columns for dates and revenue recognition. Templates with built-in formulas automate the recognition process over time. Using these templates ensures accurate reporting in sales accounting.
How do I link sales order data with accounts receivable aging in an Excel report?
Link sales order data to accounts receivable aging by using Excel functions like VLOOKUP or INDEX-MATCH to pull related information. Create a dashboard combining order status with aging buckets for complete visibility. This integrated approach improves account receivable management and reporting accuracy.