Rental Income & Expense Tracking Spreadsheet
A
Rental Income & Expense Tracking Spreadsheet document is a tool designed to systematically record and organize all rental property-related income and expenses. It helps landlords and property managers monitor cash flow, identify tax deductions, and maintain accurate financial records for budgeting and reporting purposes. By using this spreadsheet, users can streamline financial management, ensure compliance, and make informed decisions to maximize rental property profitability.
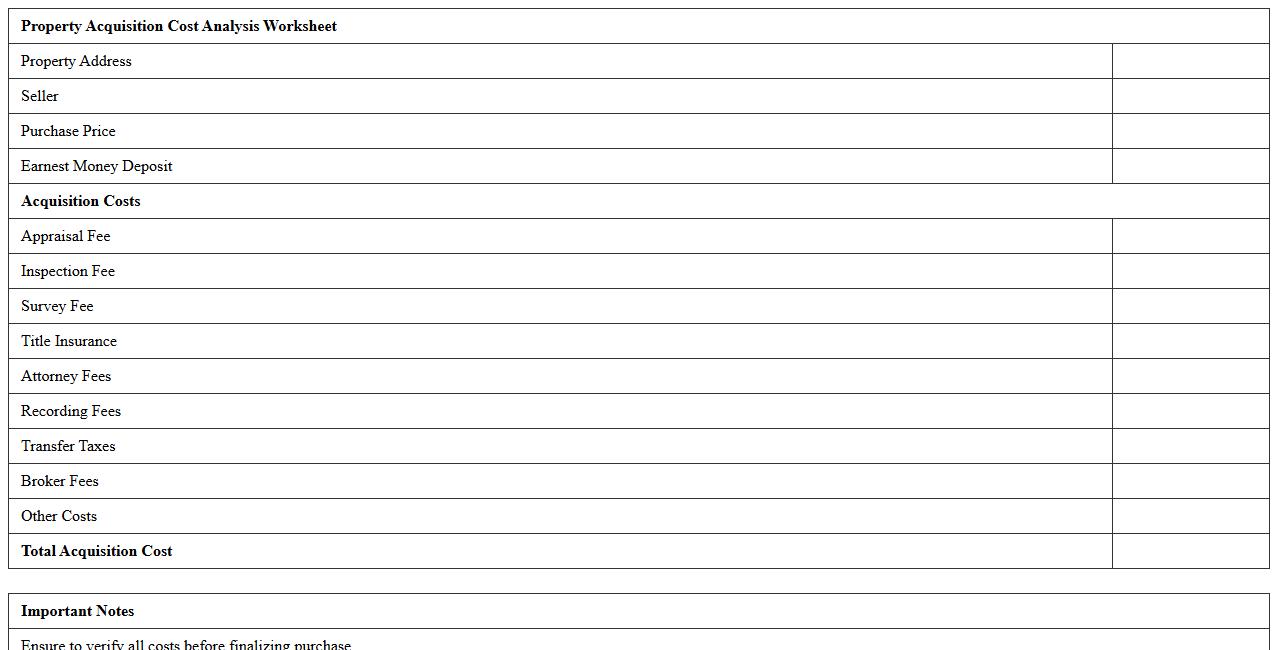
Property Acquisition Cost Analysis Worksheet
The
Property Acquisition Cost Analysis Worksheet is a detailed financial tool used to estimate and track all costs associated with acquiring real estate, including purchase price, taxes, fees, inspections, and closing expenses. It helps investors, real estate professionals, and buyers make informed decisions by providing a clear breakdown of anticipated expenses, ensuring budget accuracy and improved financial planning. Utilizing this worksheet streamlines the property evaluation process, reducing the risk of unexpected costs and enhancing overall investment strategy.
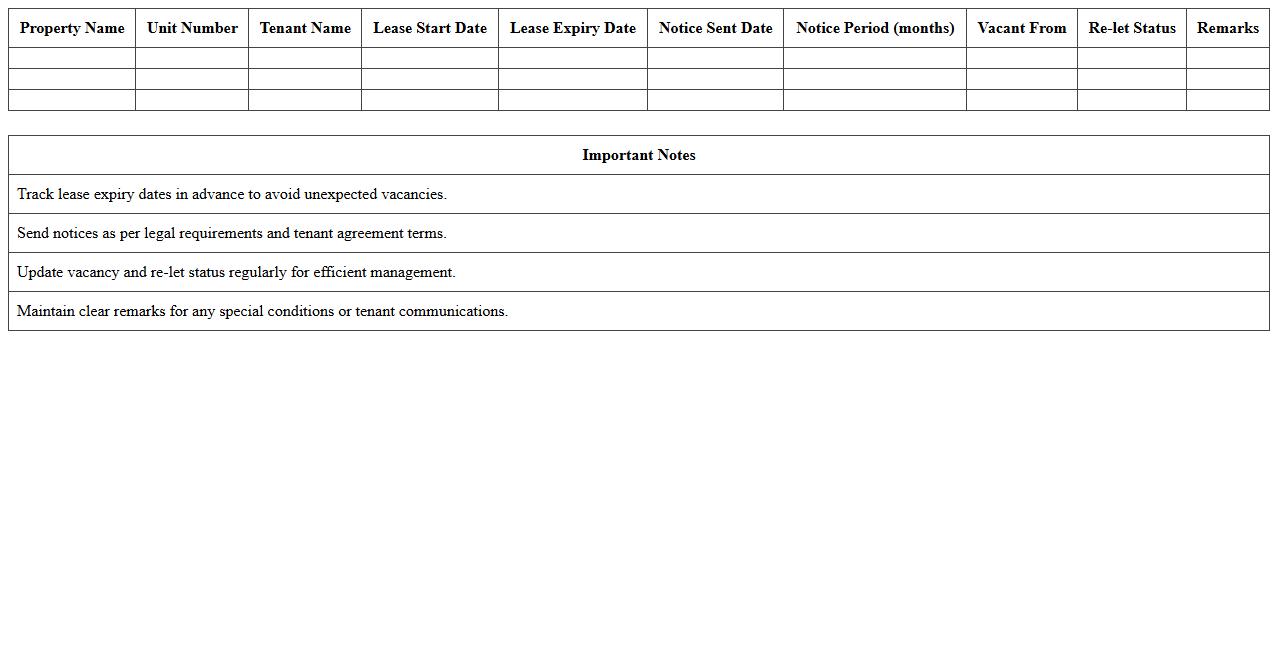
Lease Expiry & Vacancy Management Log
The
Lease Expiry & Vacancy Management Log document tracks all lease expiration dates and upcoming vacancies within a property portfolio, enabling proactive tenant retention and lease renewal strategies. This log helps property managers anticipate vacancy periods, plan marketing efforts, and minimize revenue loss by ensuring timely lease negotiations and space re-letting. Efficient use of this document enhances occupancy rates, optimizes cash flow, and supports strategic decision-making in property management.
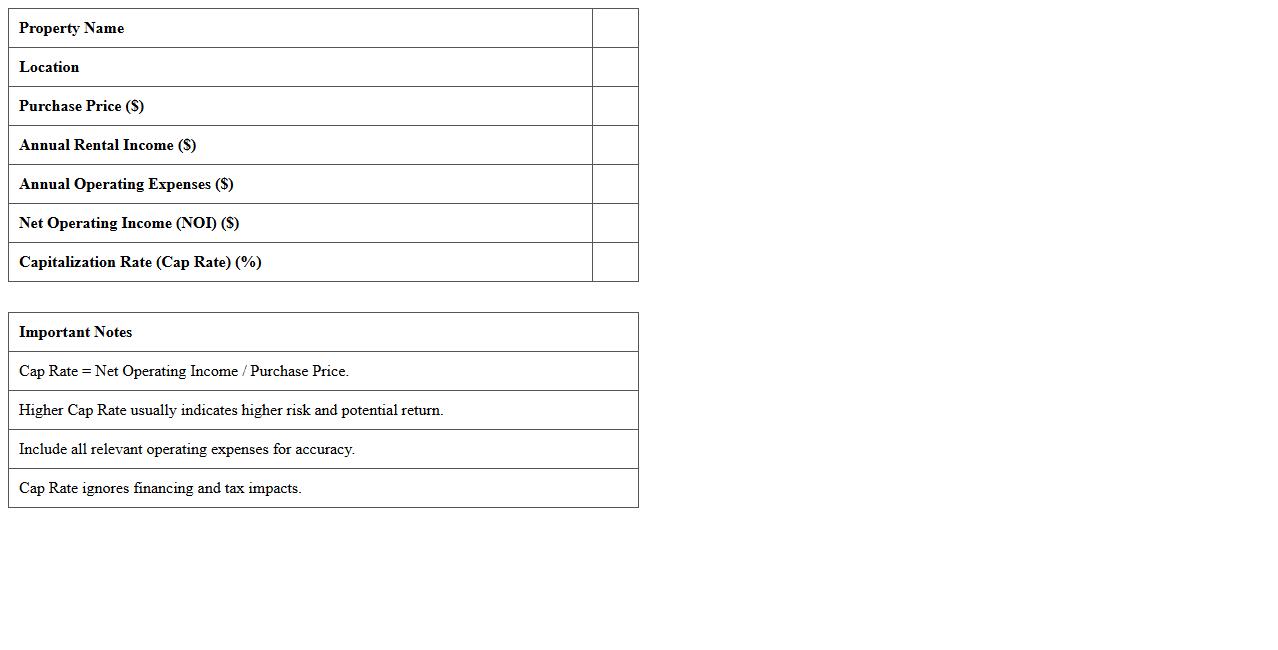
Capitalization Rate (Cap Rate) Calculator Template
A
Capitalization Rate (Cap Rate) Calculator Template document is a tool designed to estimate the potential return on investment for real estate properties by calculating the cap rate using net operating income and property value. It streamlines the analysis process, allowing investors to quickly assess property profitability and compare investment opportunities. This template enhances decision-making by providing clear, consistent metrics essential for evaluating real estate risks and returns.
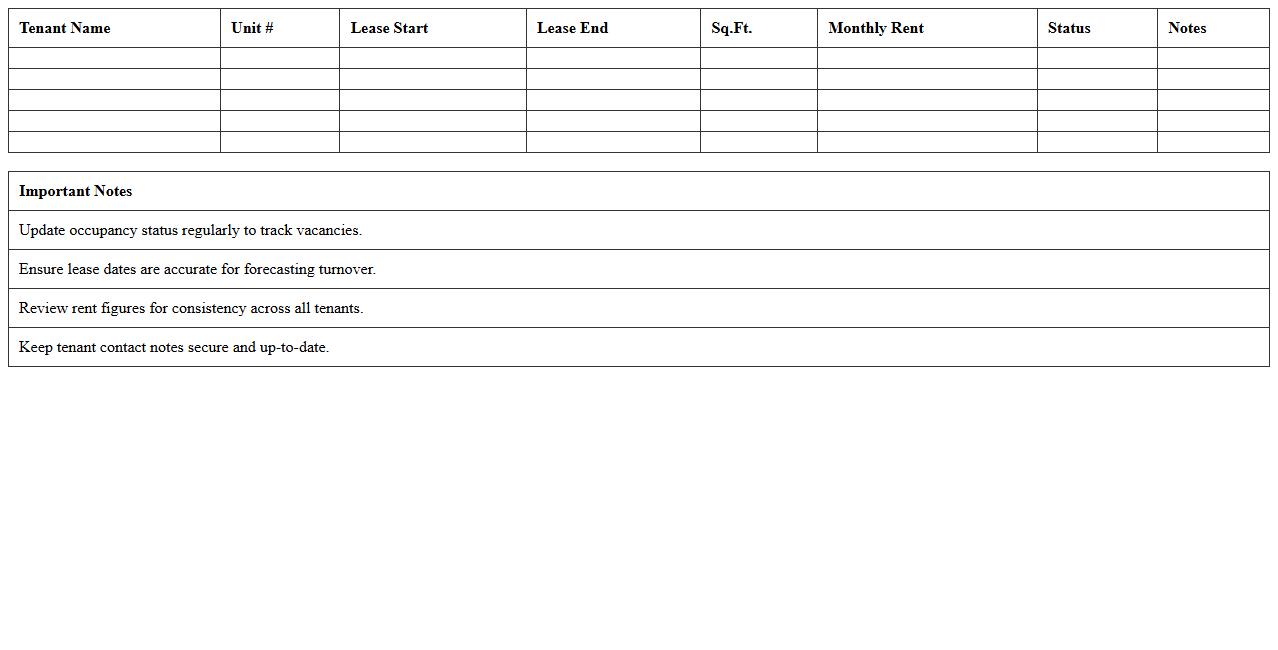
Tenant Rent Roll & Occupancy Dashboard
The
Tenant Rent Roll & Occupancy Dashboard document provides a comprehensive overview of rental income streams and occupancy status across multiple properties. It consolidates critical data such as tenant names, lease terms, rent amounts, payment history, and unit vacancies, enabling property managers to track revenue performance and identify potential risks efficiently. This dashboard enhances decision-making by offering real-time insights into lease expirations, rent arrears, and occupancy trends, thereby optimizing portfolio management and financial forecasting.
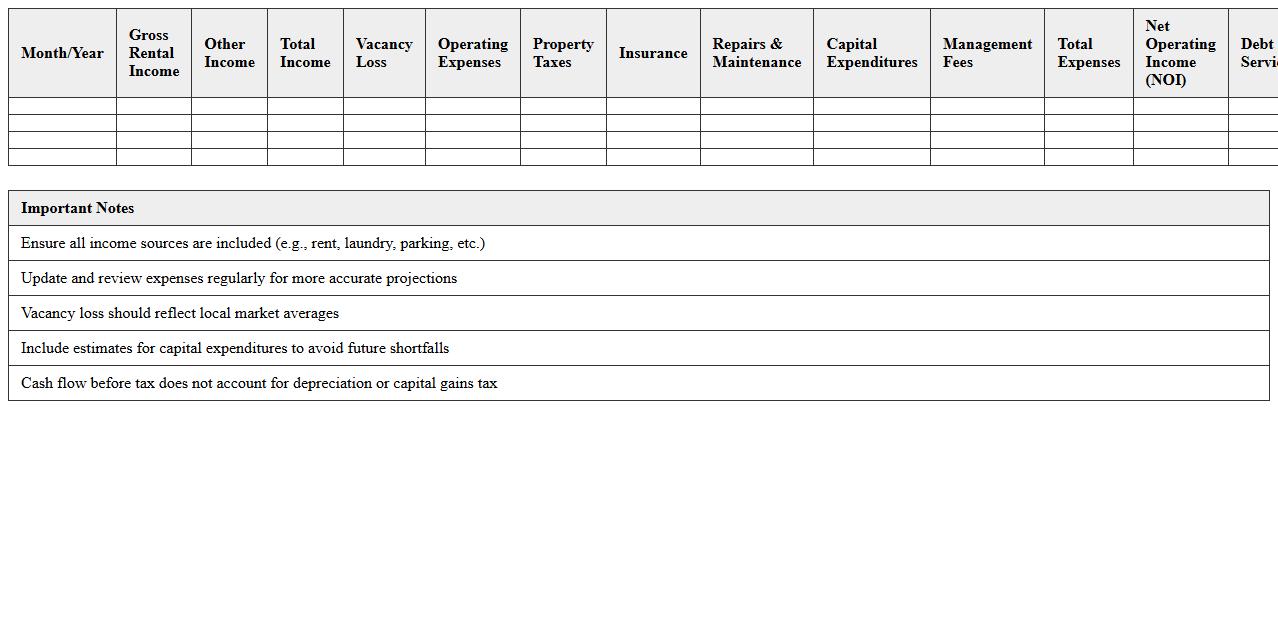
Real Estate Cash Flow Projection Sheet
A
Real Estate Cash Flow Projection Sheet is a financial document that estimates the inflows and outflows of cash associated with a real estate investment over a specific period. It helps investors and property managers forecast rental income, expenses, loan payments, and net cash flow, enabling informed decision-making and financial planning. This tool is essential for evaluating property profitability, managing budgets, and identifying potential cash shortages or surpluses.
Maintenance & Repair Expense Tracker
A
Maintenance & Repair Expense Tracker document is a detailed record used to monitor and categorize costs associated with the upkeep and repair of equipment, vehicles, or property. It helps organizations efficiently manage budgets by identifying recurring expenses and forecasting future maintenance needs. By keeping accurate expense data, businesses can optimize resource allocation, reduce unexpected downtime, and improve financial planning.
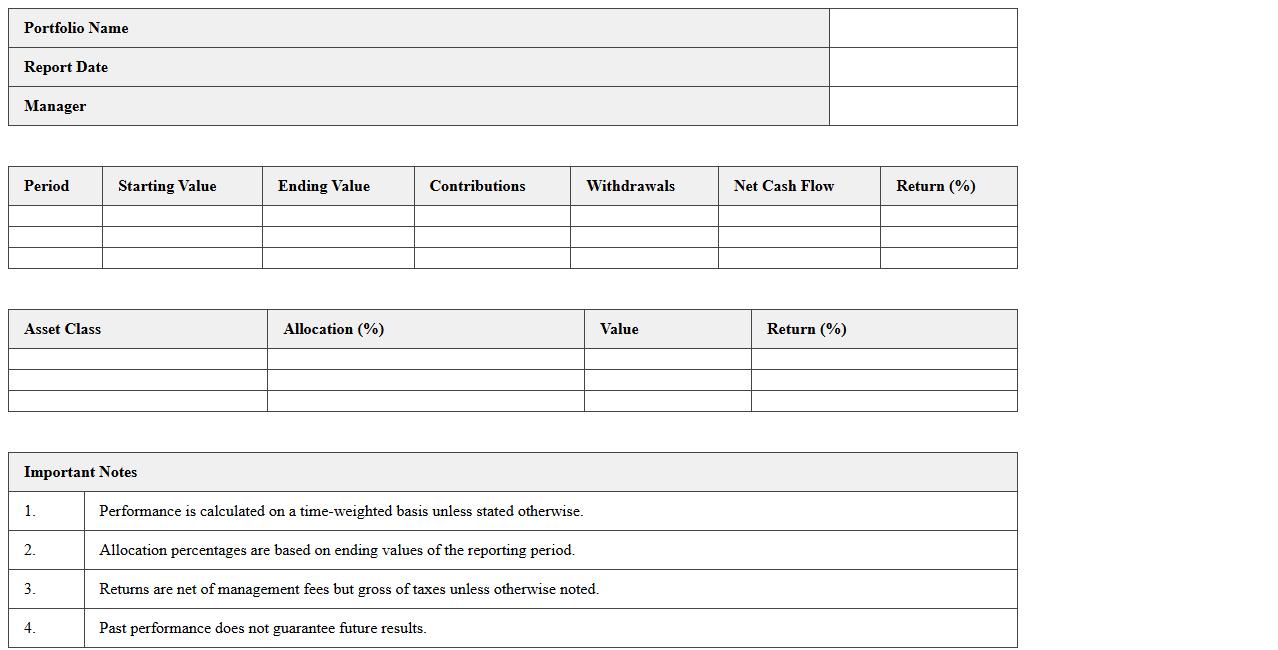
Portfolio Performance Summary Report
A
Portfolio Performance Summary Report provides an organized overview of investment results, including key metrics such as returns, volatility, and asset allocation. This report allows investors and portfolio managers to evaluate the effectiveness of investment strategies and make data-driven decisions to optimize future performance. It serves as a critical tool for tracking progress, identifying trends, and ensuring alignment with financial goals.
Loan Amortization & Debt Service Schedule
A
Loan Amortization & Debt Service Schedule document details the periodic repayment structure of a loan, showing the breakdown of principal and interest payments over time. It helps borrowers and lenders track payment timelines, outstanding balances, and interest costs, ensuring clear financial planning and accountability. By providing a comprehensive overview of debt obligations, this schedule supports effective budgeting and cash flow management.
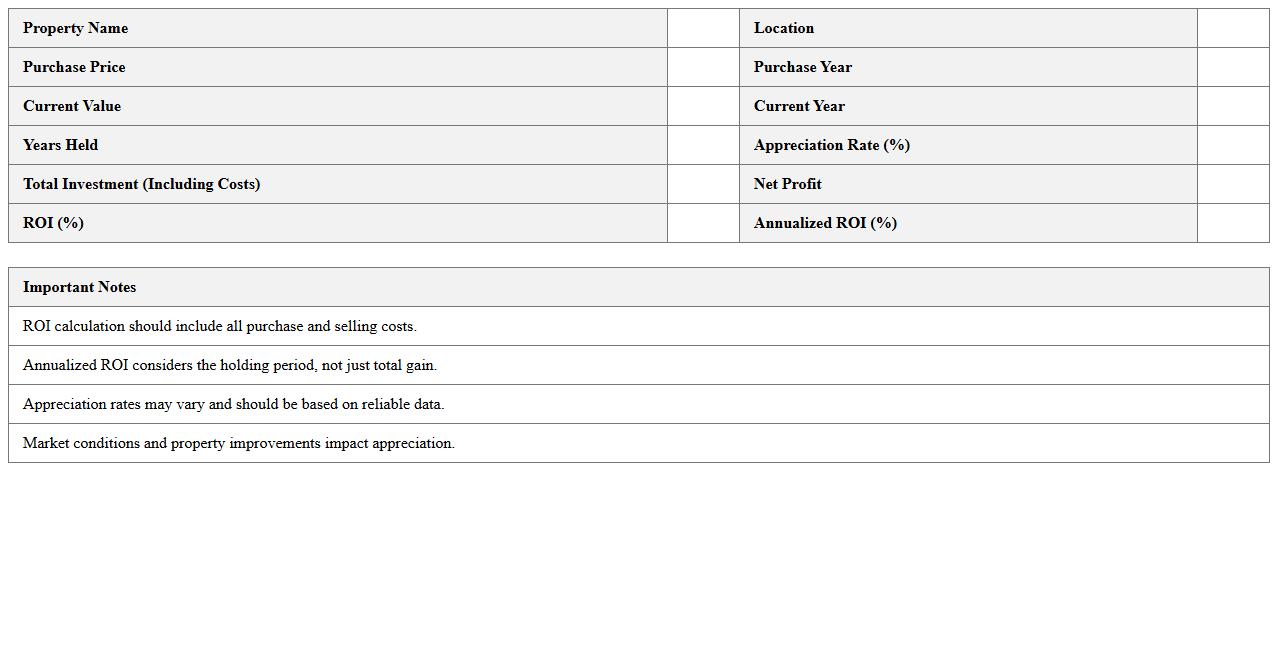
Property Value Appreciation & ROI Analyzer
The
Property Value Appreciation & ROI Analyzer document is a comprehensive tool designed to evaluate the increase in a property's market value over time and calculate the return on investment (ROI) based on rental income, expenses, and market trends. It helps investors and homeowners make informed decisions by providing detailed insights into potential financial gains and risks associated with real estate investments. Utilizing this analyzer enables users to optimize investment strategies, forecast future asset growth, and maximize profitability efficiently.
How can I automate rent roll updates in a Real Estate Portfolio Analysis Excel sheet?
To automate rent roll updates, use Excel's data validation and dynamic named ranges to ensure rent entries are current and consistent. Incorporate the INDIRECT function to reference rent amounts across different property sheets automatically. Additionally, leveraging VBA macros can streamline monthly updates by pulling data from external rent roll databases directly into your workbook.
What formulas track multi-property cash flow variances in Excel?
Formulas such as SUMIFS and INDEX-MATCH allow precise tracking of cash flow variances across multiple properties by filtering data based on criteria like date or property name. Using conditional formatting highlights significant variances, making outliers easy to spot. Additionally, combining these with OFFSET formulas can create dynamic ranges that adjust as new data is entered.
How do I integrate depreciation schedules for tax purposes in the document?
Integrate depreciation schedules by setting up an asset register with purchase dates, cost, and useful life columns linked to your tax calculation sheet. Use the SLN or DB depreciation functions in Excel to automatically calculate periodic depreciation expense per asset. These schedules can be connected to your overall portfolio analysis to reflect accurate taxable income.
Which Excel features visualize occupancy trends across multiple units?
Excel's PivotTables coupled with PivotCharts provide a powerful way to analyze and visualize occupancy trends across multiple units over time. Utilize slicers to dynamically filter properties or time periods for in-depth trend insights. Heat maps created through conditional formatting further emphasize occupancy fluctuations within your dataset.
How can I link maintenance expense logs directly to each property tab?
Use Excel's cell linking and named ranges to connect your maintenance expense logs directly to each property tab, ensuring expenses are accurately reflected in summary sheets. Implement structured tables with consistent column headers across logs for seamless referencing using VLOOKUP or XLOOKUP. For enhanced integration, pivot your maintenance data by property for intuitive expense tracking and reporting.