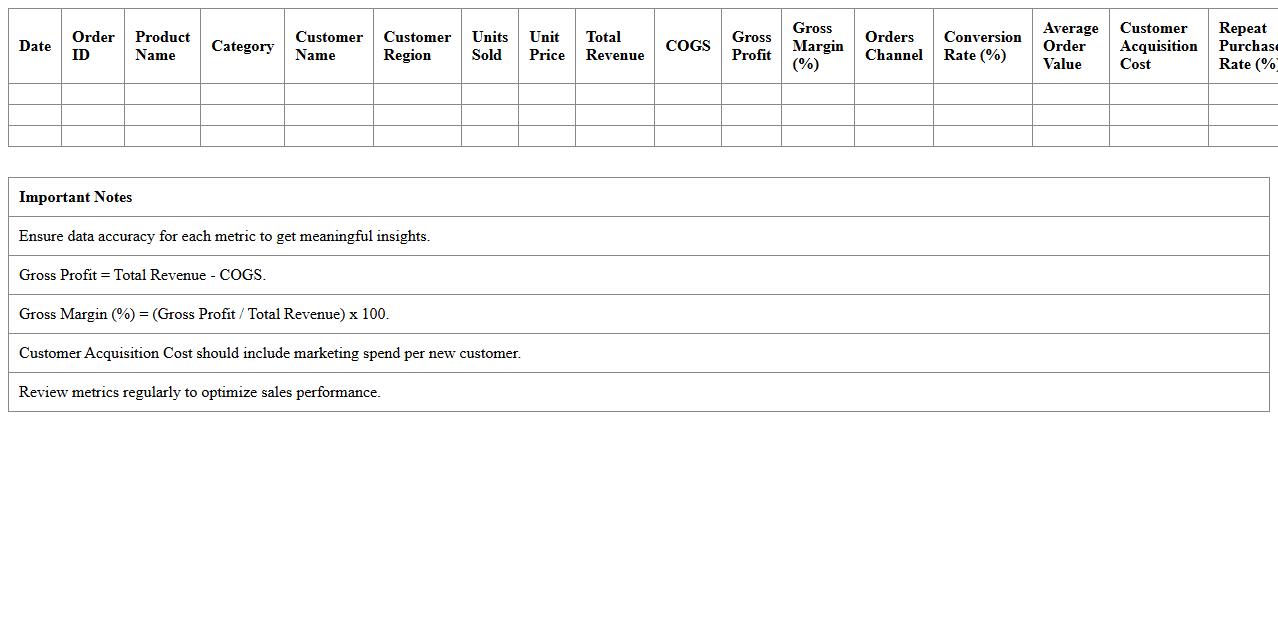
E-commerce Sales Performance Metrics Excel Template
The
E-commerce Sales Performance Metrics Excel Template is a comprehensive tool designed to track, analyze, and visualize key sales data such as revenue, conversion rates, average order value, and customer acquisition costs. It enables businesses to identify trends, measure growth, and pinpoint areas for improvement through customizable charts and data summaries. By leveraging this template, companies can make data-driven decisions that enhance sales strategies and boost overall online business performance.
Online Store Conversion Rate Dashboard Excel Template
The
Online Store Conversion Rate Dashboard Excel Template is a powerful tool designed to track and analyze the percentage of visitors who complete a purchase on your e-commerce website. This template consolidates key performance metrics such as session data, sales volume, and customer behavior into an easy-to-read dashboard, enabling data-driven decision making. By utilizing this document, businesses can identify conversion trends, optimize marketing strategies, and improve overall sales efficiency.
Customer Acquisition Cost Tracker Excel Template
The
Customer Acquisition Cost Tracker Excel Template is a powerful tool designed to monitor and analyze the expenses related to acquiring new customers, enabling businesses to optimize marketing budgets and improve ROI. It allows users to input data from various channels, calculate costs per lead or sale, and visualize trends over time for strategic decision-making. This document simplifies complex financial tracking, helping companies reduce unnecessary spending and enhance overall customer acquisition strategies efficiently.
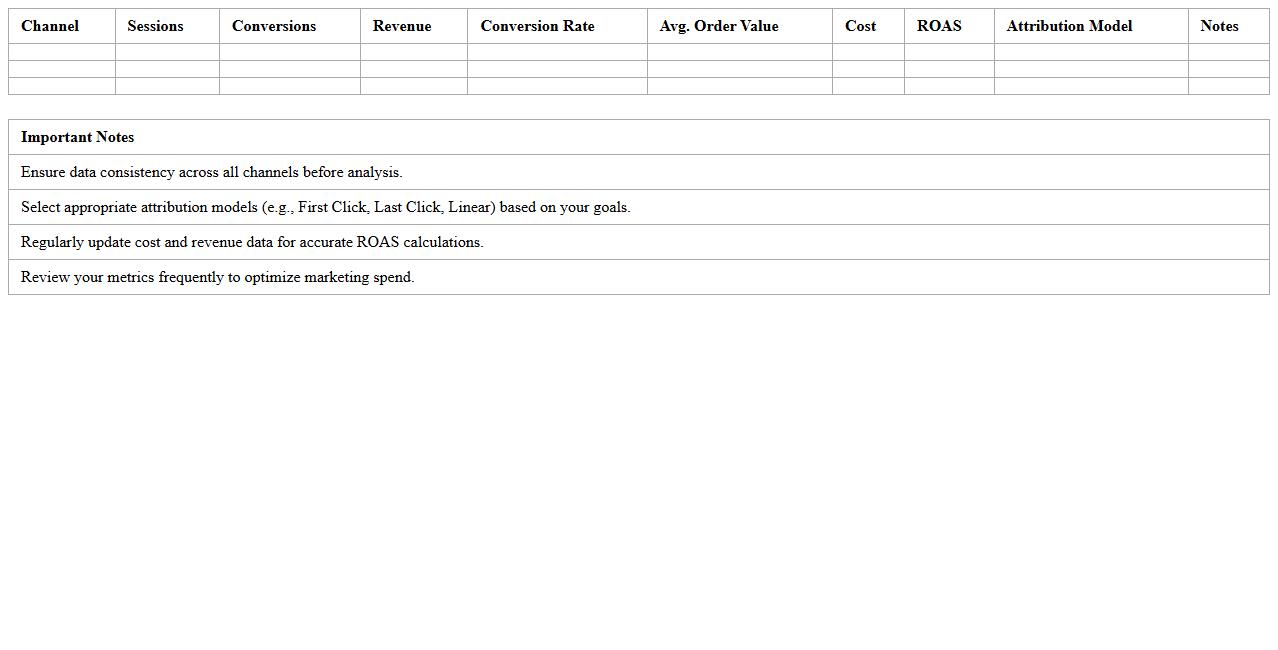
E-commerce Channel Attribution Metrics Excel Template
The
E-commerce Channel Attribution Metrics Excel Template is a powerful tool designed to track and analyze the performance of various marketing channels driving online sales. It allows businesses to allocate revenue accurately across channels such as social media, paid search, organic traffic, and email campaigns, offering clear insights into customer acquisition and conversion paths. This template enhances decision-making by identifying high-performing channels and optimizing marketing budgets for improved return on investment.
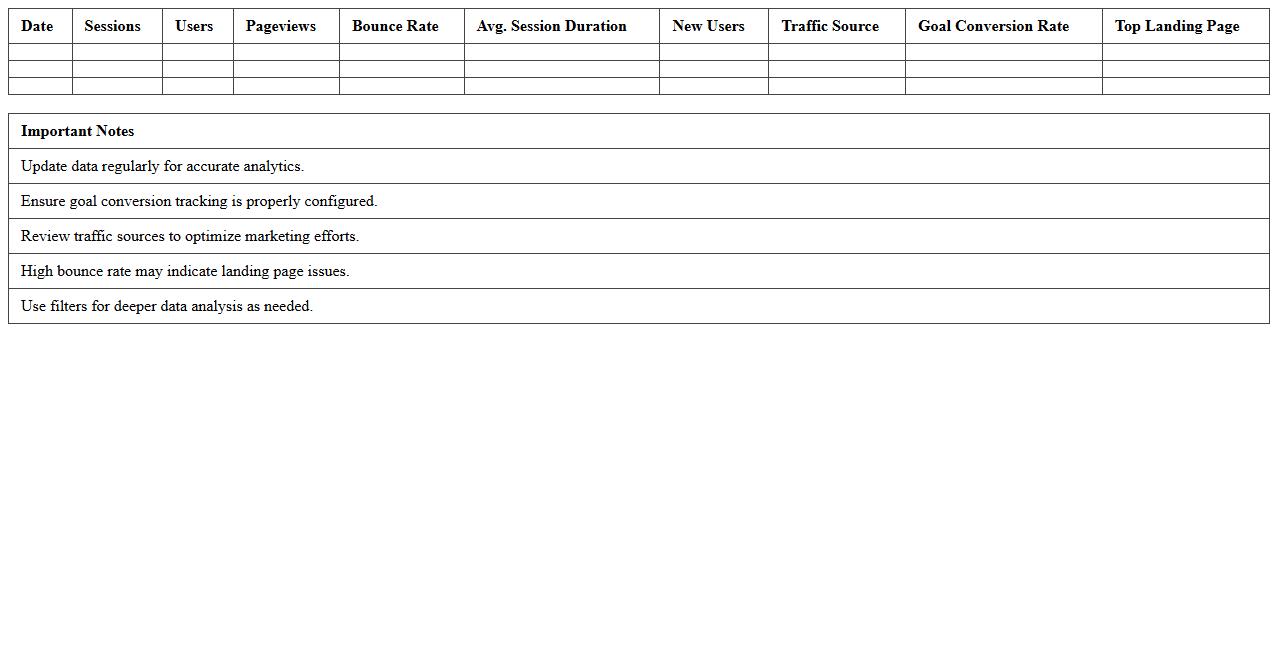
Website Traffic Analytics Dashboard Excel Template
The
Website Traffic Analytics Dashboard Excel Template is a data visualization tool designed to track, analyze, and interpret website visitor metrics such as page views, bounce rates, session duration, and traffic sources. This template helps businesses and marketers identify trends, optimize content strategies, and improve user engagement by providing clear and actionable insights within an easily customizable Excel format. Using this dashboard enables efficient monitoring of website performance, facilitating data-driven decisions that enhance digital marketing efforts and drive growth.
Product Performance KPI Tracker Excel Template
The
Product Performance KPI Tracker Excel Template is a specialized document designed to monitor and analyze key performance indicators related to product success, such as sales growth, customer satisfaction, and market share. It provides a clear, organized framework to visualize trends, identify strengths and weaknesses, and make data-driven decisions that enhance product strategies. Using this template improves efficiency by consolidating complex data into actionable insights, ultimately driving better performance outcomes.
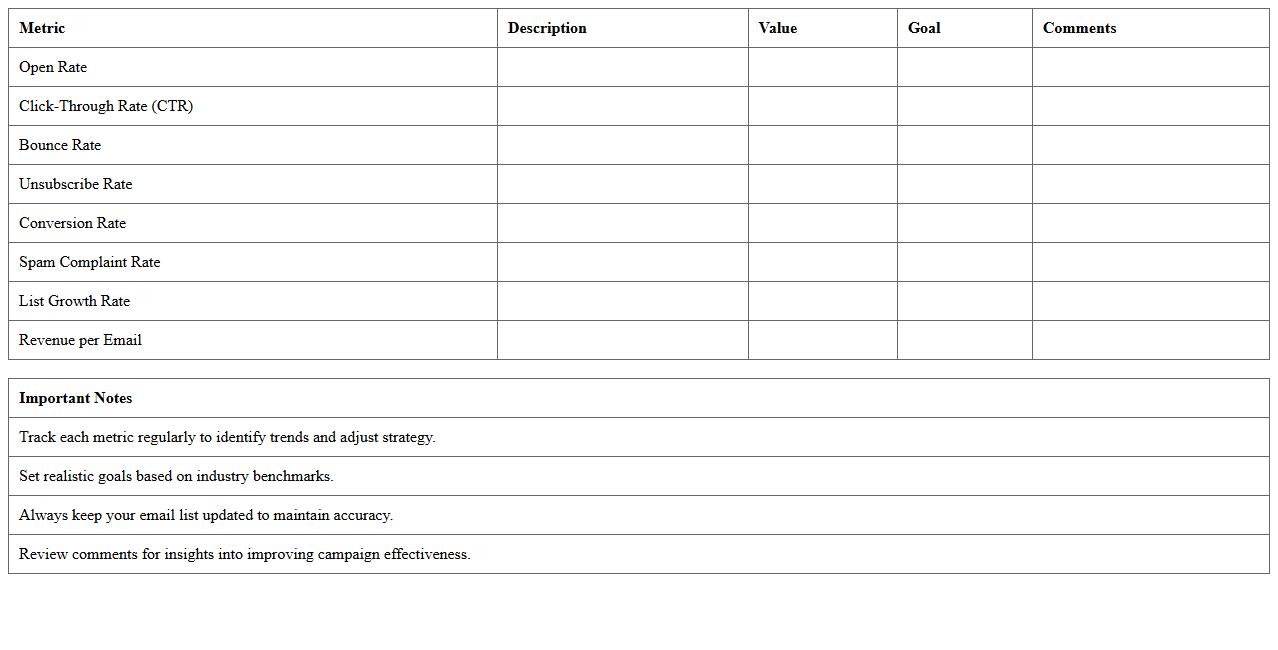
Email Marketing Metrics Dashboard Excel Template
An
Email Marketing Metrics Dashboard Excel Template is a pre-designed spreadsheet that consolidates key email campaign data such as open rates, click-through rates, conversion rates, and unsubscribe rates into one comprehensive view. This document allows marketers to track performance trends, analyze ROI, and identify areas for improvement in email marketing strategies with ease. By centralizing these metrics, it enhances decision-making, streamlines reporting, and boosts the effectiveness of future campaigns.
Social Media ROI Excel Dashboard Template
The
Social Media ROI Excel Dashboard Template is a powerful tool designed to track and analyze the return on investment from social media campaigns by consolidating data such as engagement rates, conversion metrics, and ad spend into a visually intuitive format. It enables marketers and businesses to make data-driven decisions by providing clear insights into which platforms and content types deliver the highest value. This template streamlines performance measurement, saves time on reporting, and helps optimize budget allocation to maximize social media effectiveness.
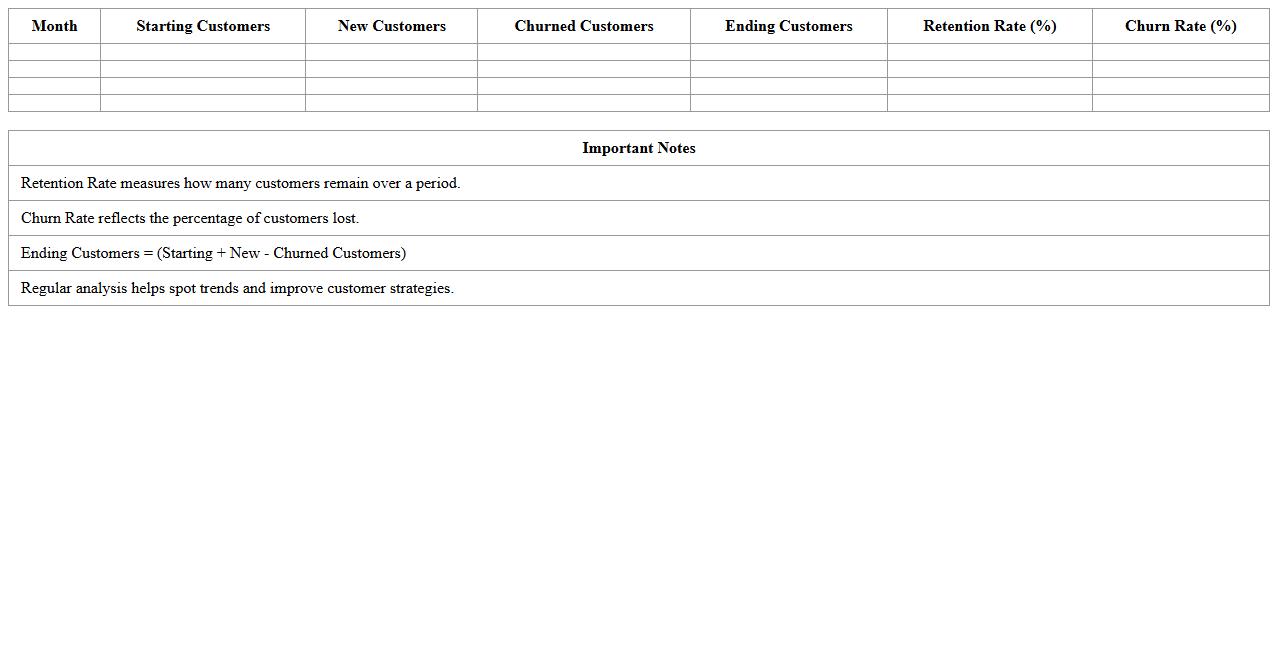
Retention Rate & Churn Analysis Excel Template
Retention Rate & Churn Analysis Excel Template is a powerful tool designed to track and analyze customer retention and churn metrics over time. By utilizing this template, businesses can visually monitor trends in customer loyalty, identify patterns of attrition, and pinpoint critical areas for improvement in customer engagement strategies. This
data-driven approach enables companies to optimize customer retention efforts, reduce churn rates, and ultimately increase long-term revenue growth.
E-commerce Marketing Budget vs. Revenue Tracker Excel Template
The
E-commerce Marketing Budget vs. Revenue Tracker Excel Template is a powerful tool designed to monitor and compare marketing expenditures against generated revenue in online retail businesses. By organizing data into clear, actionable insights, this template helps businesses optimize spending, identify high-performing campaigns, and improve overall ROI. It streamlines financial analysis, enabling more strategic decision-making and better allocation of marketing resources.
How can I track customer acquisition cost (CAC) monthly in the Marketing Metrics Dashboard Excel for e-commerce?
To track customer acquisition cost (CAC) monthly, first aggregate all marketing expenses for each month in Excel. Divide the total monthly marketing spend by the number of new customers acquired during the same period. Use a dynamic table or pivot chart to summarize CAC values and update them automatically as new data is entered.
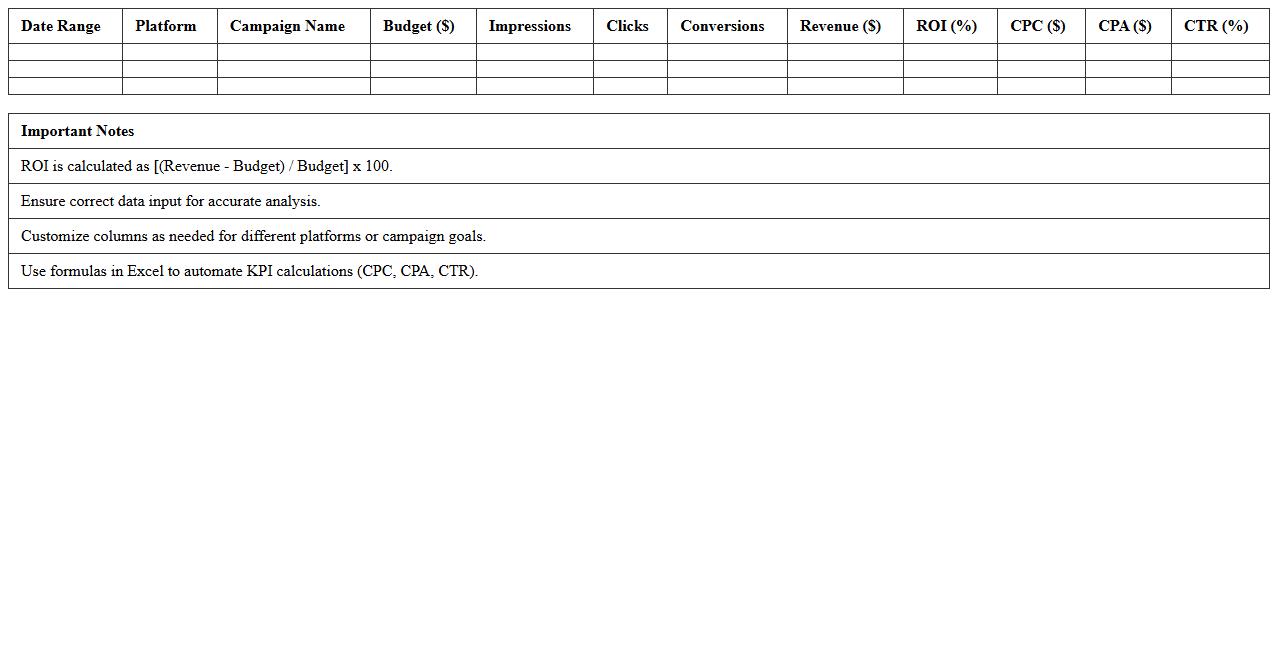
What Excel formulas best automate ROI calculations for ad campaigns within my dashboard?
The ROI calculation for ad campaigns can be automated using the formula =((Revenue - Cost) / Cost) * 100. Use Excel's SUMIFS to attribute revenue and cost to specific campaigns. Embedding these formulas in your dashboard cells allows instant ROI updates when new campaign data is added.
How do I visualize conversion rate trends by channel on the dashboard?
To visualize conversion rate trends by channel, set up a pivot table summarizing conversions and visits by channel and month. Calculate conversion rates by dividing conversions by visits. Incorporate a line or combo chart next to your pivot to reveal meaningful trends across different marketing channels over time.
Which filters allow product-category-specific insights in the Excel dashboard?
Product-category-specific insights can be enabled by applying slicers or filter dropdowns linked to your product category data. These filters dynamically update your dashboard's visualizations and metrics to reflect selected categories only. This approach enhances user interactivity and allows targeted performance analysis within Excel.
How can I integrate Google Analytics export data into my Excel marketing dashboard?
Import Google Analytics export data into Excel by downloading reports as CSV files from your Analytics account. Use Power Query to clean, transform, and load this data directly into your dashboard workbook. This integration ensures your marketing metrics stay comprehensive and automatically update when linked to refreshed GA exports.