The Manufacturing KPI Dashboard Excel Template for Performance Monitoring offers an intuitive way to track key production metrics such as efficiency, downtime, and quality rates. This template enables real-time data visualization, helping managers identify bottlenecks and optimize operations quickly. Customizable charts and graphs ensure clear communication of performance trends to stakeholders.
Production Output KPI Tracking Excel Template
The
Production Output KPI Tracking Excel Template is a streamlined document designed to monitor and analyze key performance indicators related to manufacturing productivity and efficiency. It allows users to track daily, weekly, or monthly production volumes, identify trends, and pinpoint areas for operational improvement. Utilizing this template enhances data-driven decision-making by providing clear visual reports and metrics that support optimization of production processes.
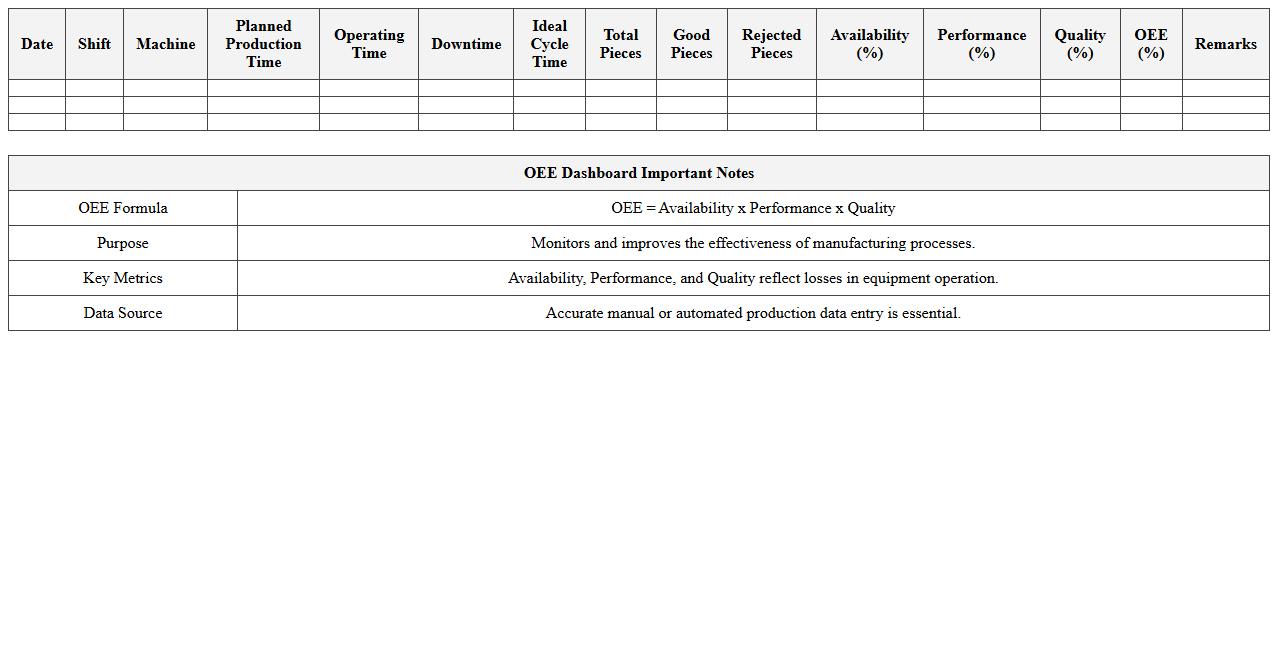
OEE (Overall Equipment Effectiveness) Dashboard Template
An
OEE (Overall Equipment Effectiveness) Dashboard Template document serves as a structured tool to visually track and analyze manufacturing equipment performance through key metrics: availability, performance, and quality. It enables businesses to identify production bottlenecks, reduce downtime, and improve operational efficiency by providing real-time insights in an easily interpretable format. This template supports data-driven decision-making, helping manufacturing managers optimize equipment utilization and enhance productivity.
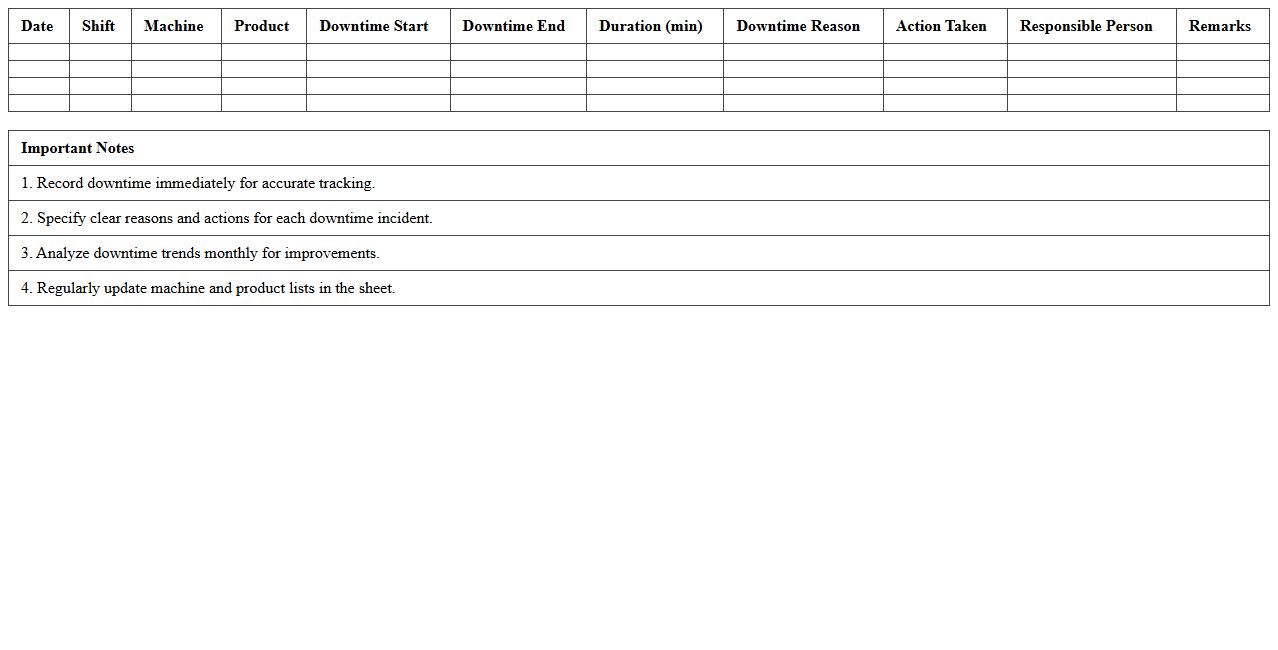
Manufacturing Downtime Analysis Excel Sheet
A
Manufacturing Downtime Analysis Excel Sheet document systematically records and evaluates periods when production equipment is not operational, helping identify patterns and root causes of downtime. It enables manufacturers to track machine performance, calculate efficiency losses, and prioritize maintenance activities, leading to improved productivity and reduced operational costs. By providing clear insights into downtime trends, this tool supports data-driven decision-making to enhance overall manufacturing effectiveness.
Quality Control Metrics Excel Tracker
The
Quality Control Metrics Excel Tracker document serves as a centralized tool for monitoring and analyzing key quality performance indicators across projects or production lines. It enables teams to systematically record defect rates, inspection results, and compliance levels, facilitating data-driven decision-making to enhance product quality. By providing real-time visualization and trend analysis, this tracker helps organizations identify issues early, reduce errors, and maintain consistent standards.
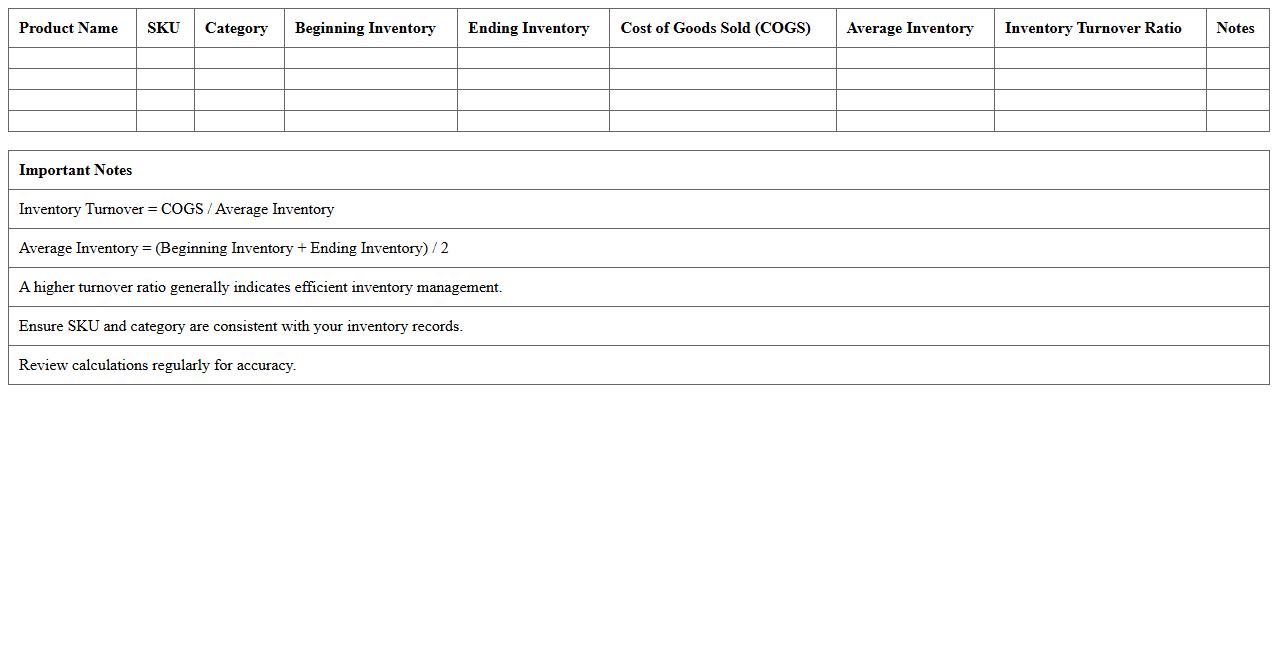
Inventory Turnover KPI Excel Template
The
Inventory Turnover KPI Excel Template document is a powerful tool designed to track and analyze the rate at which inventory is sold and replaced over a specific period. It helps businesses optimize stock levels, reduce holding costs, and improve cash flow by providing clear insights into inventory performance. Using this template, companies can make data-driven decisions to enhance supply chain efficiency and boost overall profitability.
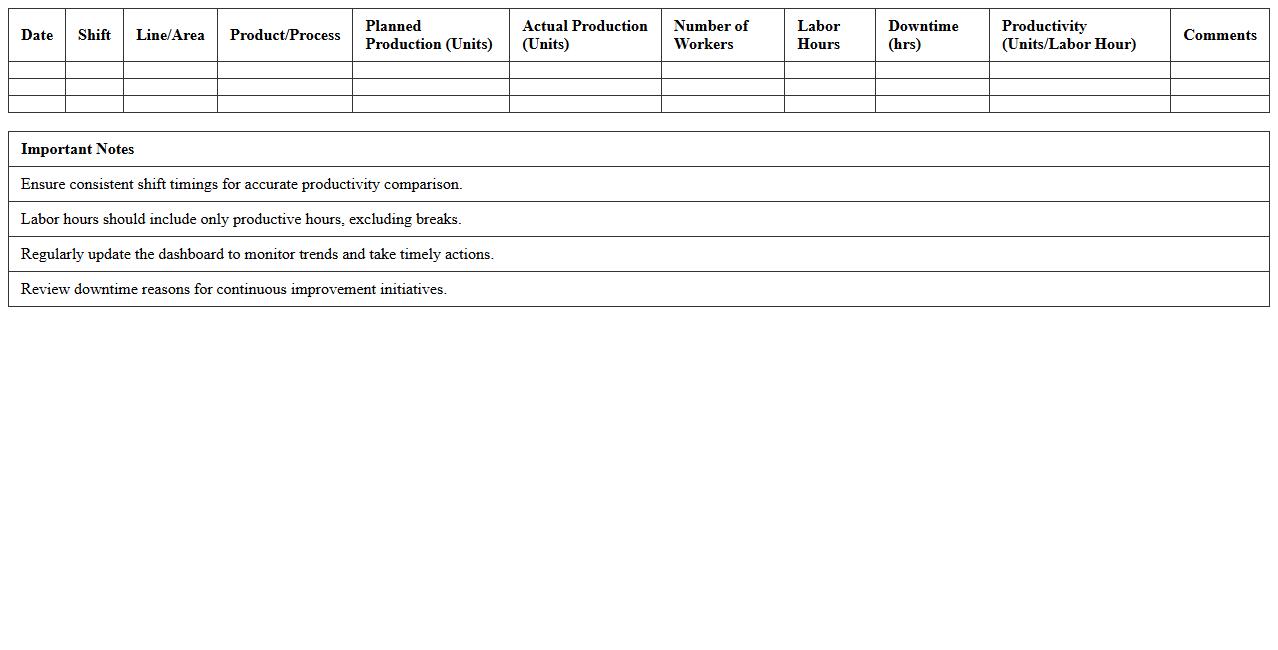
Manufacturing Labor Productivity Excel Dashboard
The
Manufacturing Labor Productivity Excel Dashboard is a powerful tool designed to track, analyze, and visualize labor efficiency and output in manufacturing operations. It consolidates key performance indicators such as labor hours, production units, and efficiency rates, enabling data-driven decision-making. This dashboard helps managers identify productivity trends, pinpoint bottlenecks, and optimize workforce allocation to enhance overall manufacturing performance.
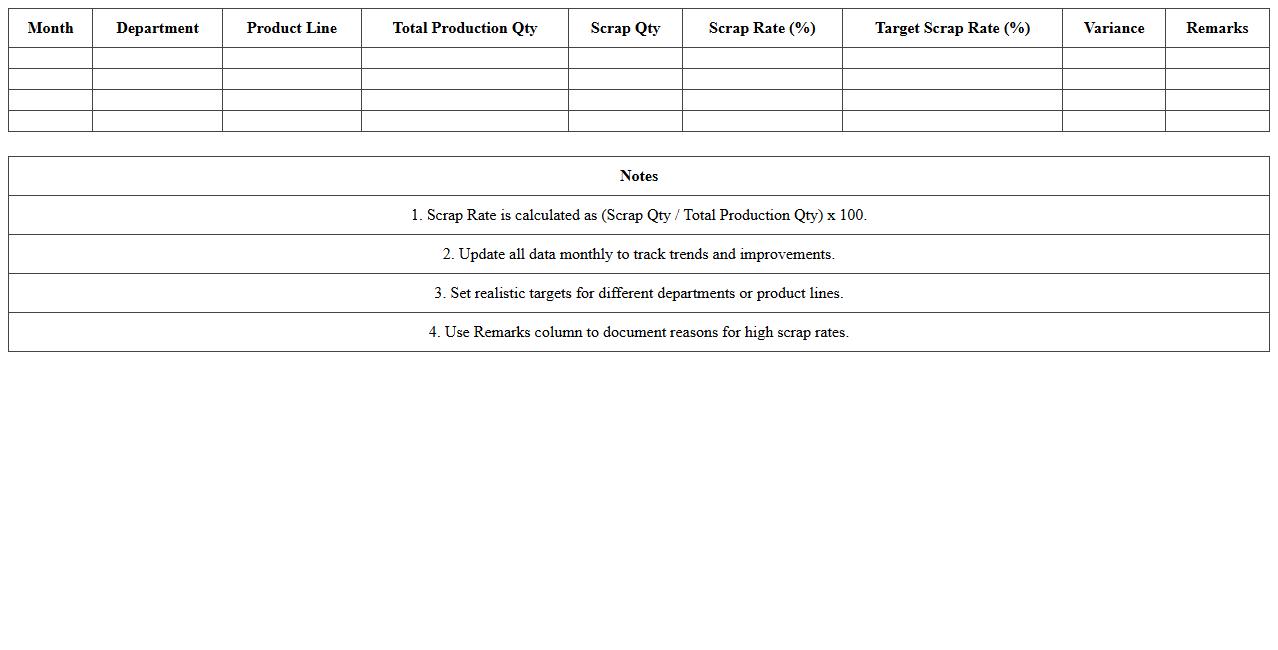
Scrap Rate Monitoring KPI Excel Sheet
The
Scrap Rate Monitoring KPI Excel Sheet is a comprehensive tool designed to track and analyze the percentage of defective or discarded materials in a manufacturing process. By regularly updating this sheet, businesses can identify trends, pinpoint production inefficiencies, and implement corrective actions to reduce waste. This KPI document supports cost reduction, quality improvement, and operational efficiency by providing clear, data-driven insights into scrap rates.
Machine Utilization Rate Excel Tracker
The
Machine Utilization Rate Excel Tracker document is a powerful tool designed to monitor and analyze the efficiency of machinery by calculating the percentage of time machines are actively used versus available. It helps businesses identify underutilized equipment, optimize maintenance schedules, and improve overall operational productivity. This tracker enables data-driven decisions that can reduce downtime, increase output, and enhance cost-effectiveness in manufacturing or production environments.
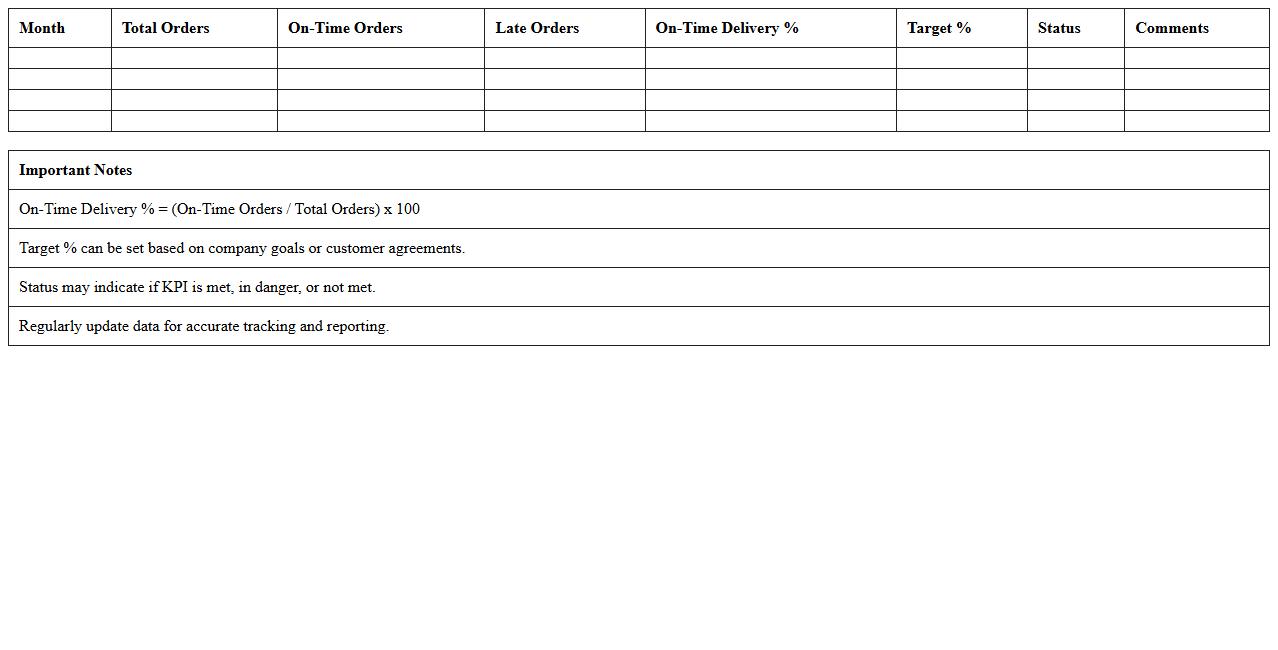
On-Time Delivery KPI Dashboard Template
The
On-Time Delivery KPI Dashboard Template document is designed to track and visualize key performance metrics related to delivery schedules, highlighting the percentage of orders delivered within the planned timeframe. This tool helps businesses monitor supply chain efficiency, identify bottlenecks, and improve customer satisfaction by ensuring timely fulfillment. By providing real-time insights and historical trends, it supports data-driven decision-making and enhances operational performance.
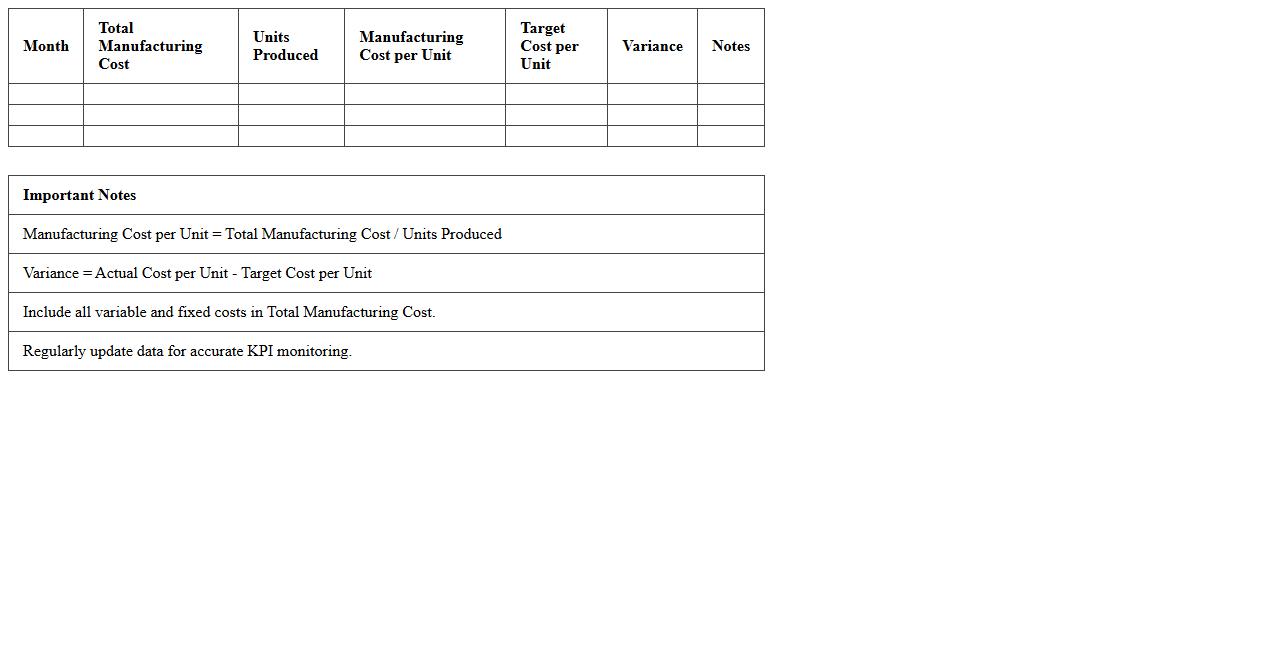
Manufacturing Cost Per Unit KPI Excel Template
The
Manufacturing Cost Per Unit KPI Excel Template document is a specialized tool designed to calculate and analyze the cost incurred to produce each unit of a product. It helps businesses accurately track direct materials, labor, and overhead costs, ensuring precise cost management and pricing strategies. Using this template streamlines financial reporting, enhances cost control, and supports informed decision-making to improve overall manufacturing efficiency.
What custom metrics can be tracked in a Manufacturing KPI Dashboard Excel template?
A Manufacturing KPI Dashboard in Excel allows tracking of key custom metrics such as production volume, defect rates, and machine utilization. These metrics provide deep insights into the operational performance and help identify bottlenecks quickly. Additionally, metrics like cycle time, labor efficiency, and overall equipment effectiveness (OEE) can be tailored to suit specific manufacturing processes.
How does real-time data updating work in Excel for production efficiency?
Real-time data updating in Excel typically uses connections to live databases or data feeds through Power Query or VBA scripts. This setup ensures production efficiency metrics refresh automatically without manual intervention. By integrating IoT sensors or ERP systems, Excel dashboards can display up-to-the-minute performance figures for immediate decision-making.
What are the best practices for visualizing downtime causes in the dashboard?
Best practices for visualizing downtime causes include using pie charts and Pareto diagrams to highlight the most frequent issues clearly. Color-coded segments enhance quick identification of critical downtime reasons for targeted improvements. Additionally, incorporating trend lines helps in monitoring downtime occurrences over time for proactive maintenance planning.
How can the dashboard automate shift-wise performance comparisons?
Automating shift-wise performance comparisons in Excel involves using dynamic pivot tables and slicers that filter data by shift timings. Formulas like SUMIFS enable separate calculations for each shift's output and efficiency. This automation streamlines performance tracking, allowing managers to quickly compare shift productivity and make informed scheduling decisions.
What Excel formulas optimize quality control tracking in KPI monitoring?
Excel formulas such as COUNTIF, AVERAGEIF, and IFERROR are essential for optimizing quality control tracking in manufacturing KPIs. COUNTIF helps count defective items, while AVERAGEIF calculates average defect rates under specific conditions. IFERROR ensures the dashboard remains clean by handling calculation errors gracefully, maintaining accurate KPI monitoring.
More Manufacturing Excel Templates