The Education Performance Analysis Excel Template for Administrators streamlines data management by providing comprehensive tools to track student performance, attendance, and assessment results. This template enables administrators to generate detailed reports, identify trends, and make data-driven decisions to improve educational outcomes. Its user-friendly format ensures efficient monitoring and evaluation across multiple classes and grade levels.
Student Achievement Tracking Excel Template
The
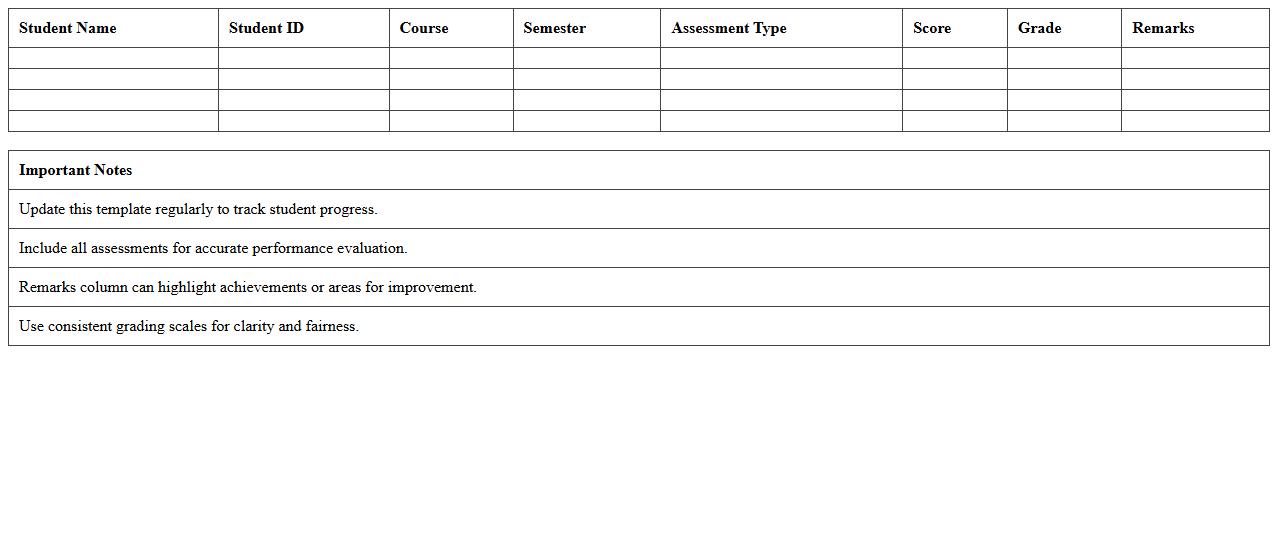
Student Achievement Tracking Excel Template is a structured spreadsheet designed to monitor and evaluate students' academic progress and performance across various subjects and assessments. It helps educators and administrators easily input, organize, and analyze key data points such as grades, attendance, and skill mastery to identify trends and areas needing improvement. This tool enhances data-driven decision-making, promotes personalized learning strategies, and supports overall student success through systematic and efficient tracking.
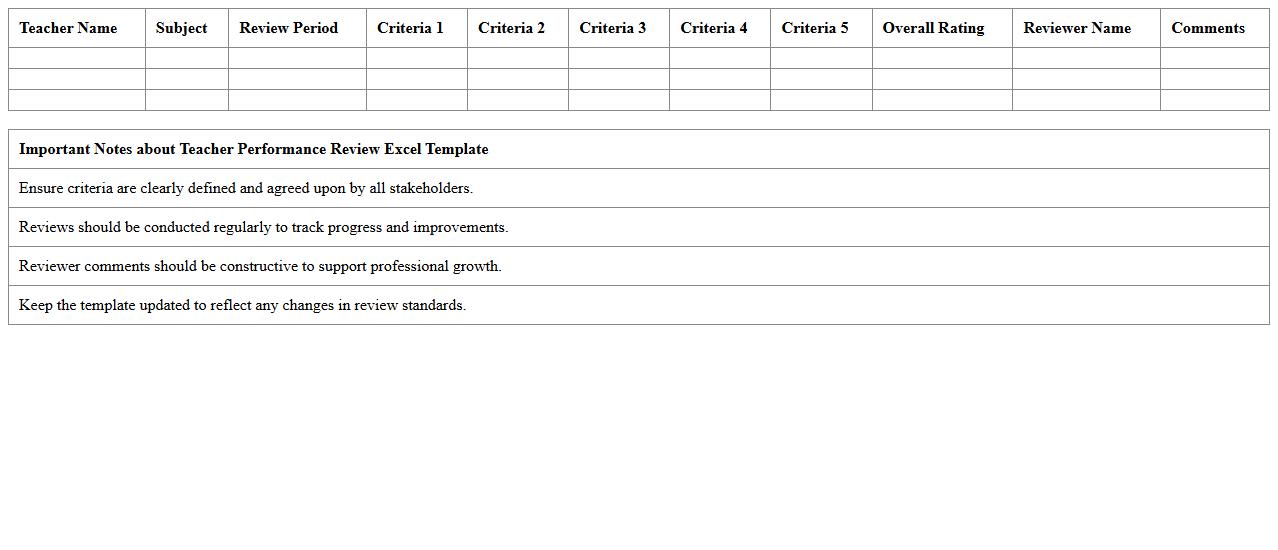
Teacher Performance Review Excel Template
The
Teacher Performance Review Excel Template document is a structured tool designed to assess and track educators' effectiveness using quantifiable metrics such as lesson planning, student engagement, and professional development. It facilitates easy data entry and analysis, enabling administrators to identify strengths and areas for improvement systematically. This template streamlines the review process, supports data-driven decision-making, and enhances overall educational quality by providing clear performance insights.
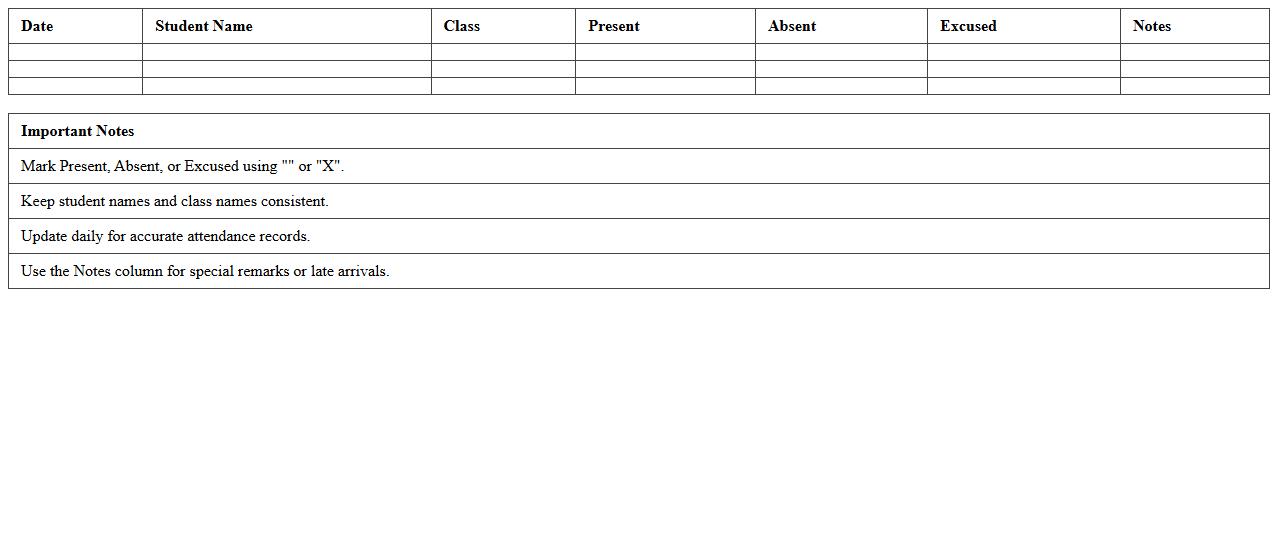
School Attendance Monitoring Excel Template
The
School Attendance Monitoring Excel Template is a structured digital tool designed to record and track student attendance efficiently. It organizes daily, weekly, or monthly attendance data, enabling educators to identify patterns, address absenteeism, and improve overall student engagement. This template simplifies reporting and ensures accurate, real-time attendance management for better academic planning and compliance with school policies.
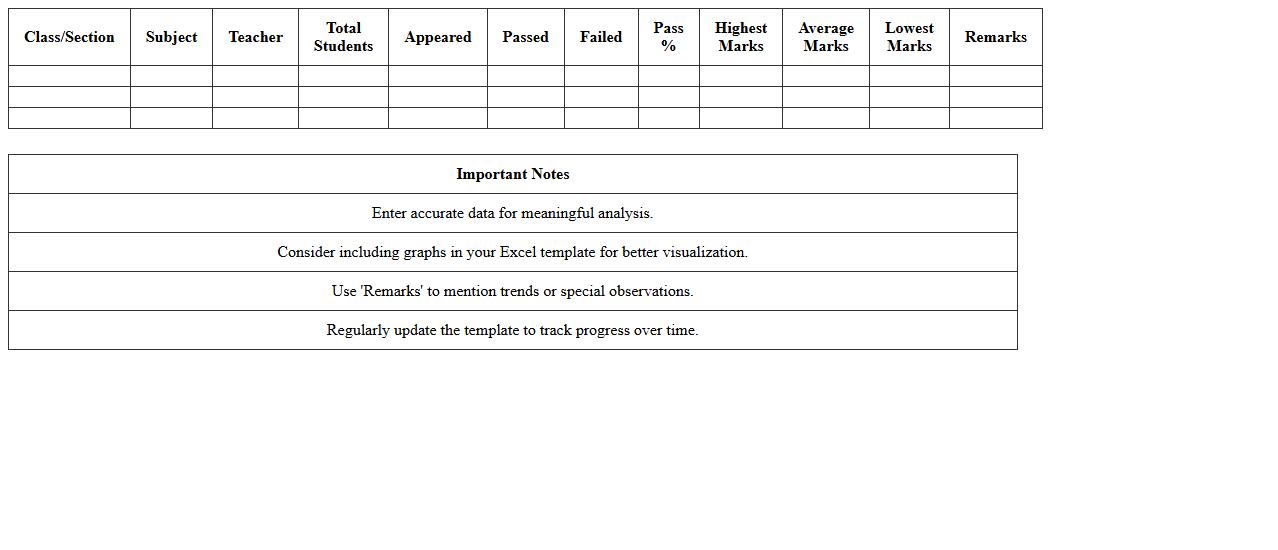
Subject-wise Results Analysis Excel Template
The
Subject-wise Results Analysis Excel Template is a structured spreadsheet designed to systematically organize and evaluate academic performance across different subjects. This tool facilitates detailed insights by breaking down student scores subject-wise, enabling educators and administrators to identify strengths, weaknesses, and trends efficiently. By leveraging this template, schools can implement targeted interventions and improve overall educational outcomes through data-driven decision-making.
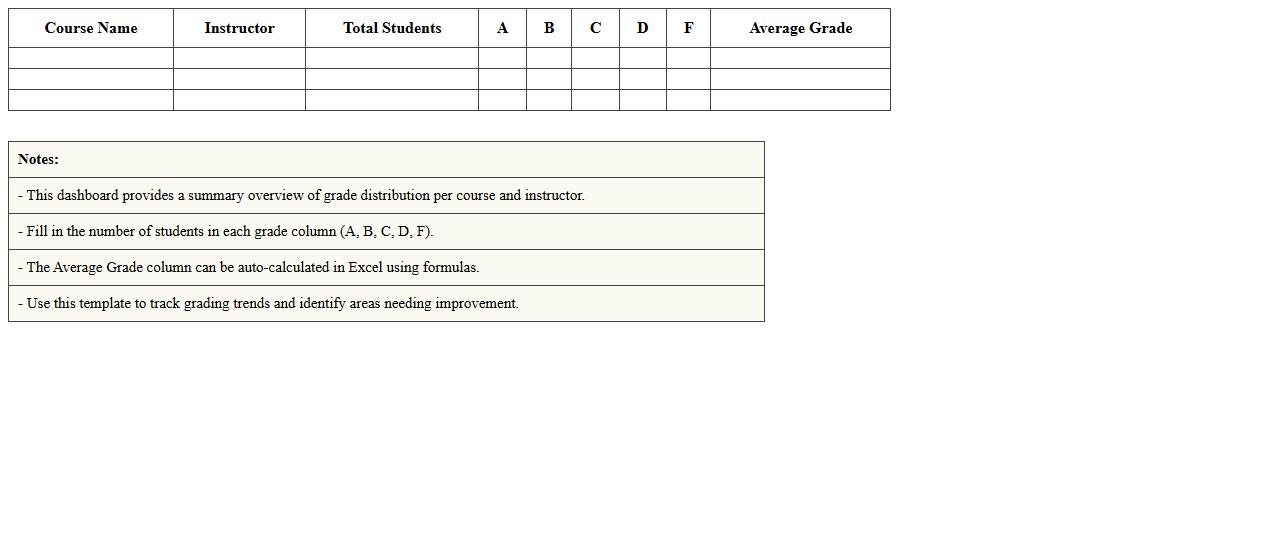
Grade Distribution Dashboard Excel Template
The
Grade Distribution Dashboard Excel Template is a powerful tool designed to visualize and analyze student grade data in a clear, interactive format. It helps educators track performance trends, identify grade patterns, and make data-driven decisions to improve teaching strategies. This template streamlines the process of monitoring academic progress, enabling efficient communication of results and supporting targeted interventions.
Academic Progress Report Excel Template
The
Academic Progress Report Excel Template is a structured spreadsheet designed to track and analyze students' academic performance over time. It allows educators and administrators to input grades, attendance, and other key metrics, providing a clear overview of individual or class progress. This template aids in identifying areas needing improvement, streamlining reporting, and enhancing data-driven decision-making in educational settings.
Classroom Assessment Summary Excel Template
The
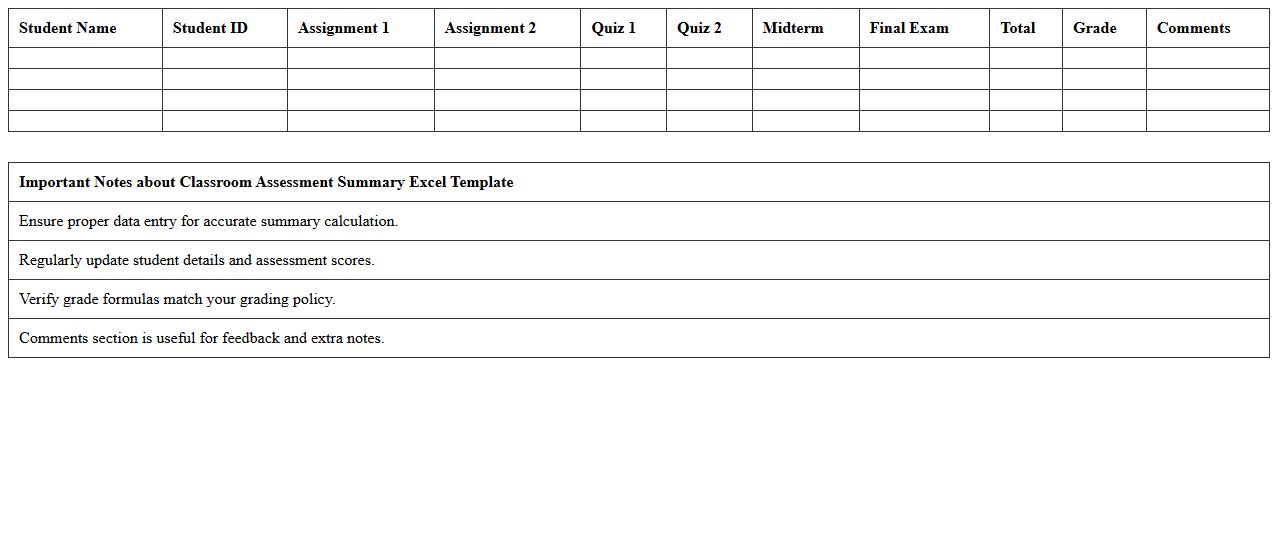
Classroom Assessment Summary Excel Template is a structured document designed to organize and analyze student performance data efficiently. It enables educators to record test scores, track progress over time, and identify areas needing improvement through clear visualizations and automated calculations. This template streamlines assessment management, saving time while enhancing data accuracy and decision-making in educational settings.
Standardized Test Scores Analysis Excel Template
The
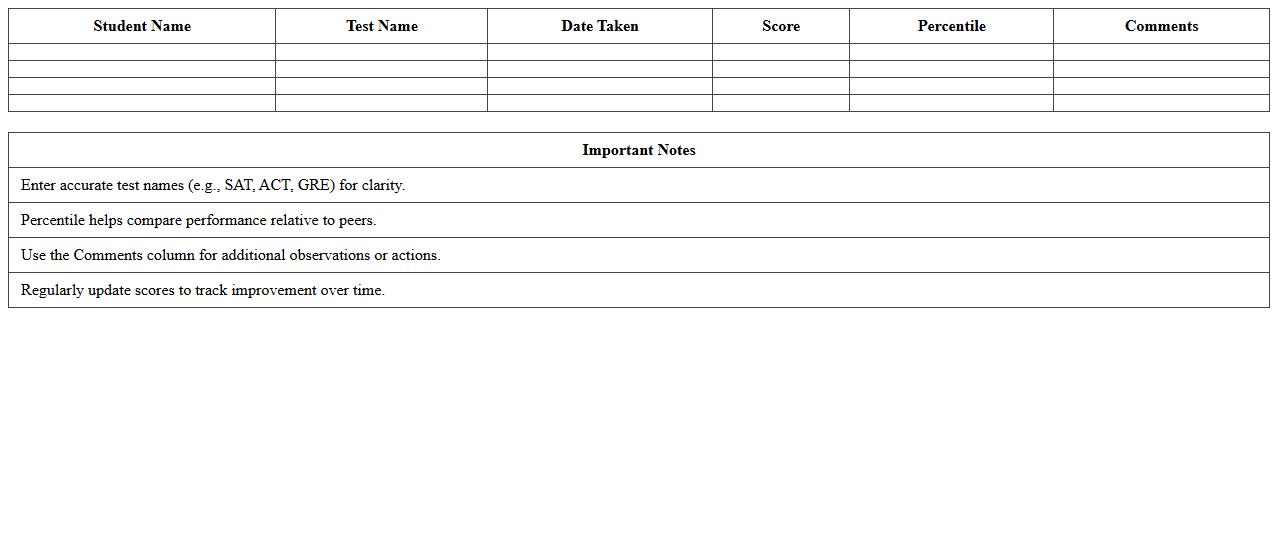
Standardized Test Scores Analysis Excel Template is a powerful tool designed to organize, interpret, and visualize students' test performance data efficiently. It enables educators and administrators to identify trends, compare results across different cohorts, and pinpoint areas needing improvement through automated calculations and graphical representations. By streamlining data analysis, this template supports informed decision-making to enhance educational outcomes and tailor instructional strategies effectively.
Year-over-Year Performance Comparison Excel Template
The
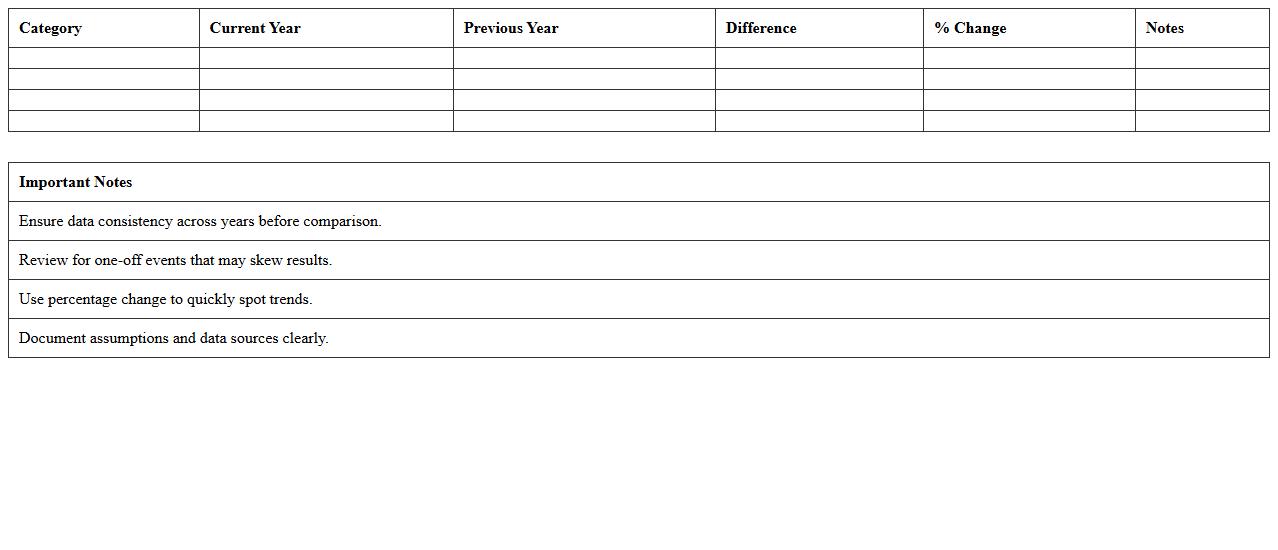
Year-over-Year Performance Comparison Excel Template is a powerful tool designed to analyze and compare business metrics across different years, enabling users to identify trends and growth patterns efficiently. It facilitates data visualization through customizable charts and tables, making it easier to interpret financial KPIs, sales figures, or operational performance over time. This template is useful for decision-makers seeking to optimize strategies by pinpointing areas of improvement and forecasting future performance based on historical data.
Remedial Program Effectiveness Tracking Excel Template
The
Remedial Program Effectiveness Tracking Excel Template is a specialized tool designed to monitor and evaluate the progress and outcomes of remedial education programs. It provides a structured format for recording student performance data, intervention strategies, and improvement metrics, enabling educators to identify areas needing adjustment. This template enhances decision-making by offering clear insights into program impact, ensuring targeted support for student success.
How can administrators automate student performance tracking using Excel formulas?
Administrators can use Excel formulas such as SUM, AVERAGE, and IF to automate student performance tracking efficiently. By incorporating nested formulas, they can calculate weighted scores and generate real-time performance summaries. Additionally, functions like VLOOKUP and INDEX-MATCH help in linking student data across multiple sheets for comprehensive tracking.
What pivot table techniques best summarize grade distributions in Excel?
Pivot tables allow for dynamic summarization of grade distributions by grouping grades into categories or ranges easily. Using features like Value Filters and Slicers, administrators can analyze trends and drill down into specific performance levels. Custom groupings and calculated fields within pivot tables further enhance the ability to generate insightful reports.
How can conditional formatting highlight at-risk students in performance sheets?
Conditional formatting in Excel is ideal for visually identifying at-risk students by applying color scales or icon sets based on grade thresholds. Setting rules to flag scores below a certain percentage immediately draws attention to students needing intervention. This technique allows educators to quickly assess and act upon critical performance data.
What Excel dashboards effectively visualize education performance metrics for stakeholders?
Effective Excel dashboards use a combination of charts, slicers, and pivot tables to display education performance metrics clearly to stakeholders. Interactive features like drop-down menus allow users to filter data by classes or time periods. Visual elements such as bar graphs, pie charts, and heat maps enhance comprehension and decision-making.
Which data validation methods ensure accurate entry of assessment scores in Excel?
Data validation rules like setting numeric limits and drop-down lists ensure that only valid assessment scores are entered into Excel sheets. By restricting inputs to acceptable ranges (e.g., 0-100), errors in data entry are minimized. Custom error messages guide users to input accurate and consistent data for reliable performance analysis.
More Education Excel Templates