Corn Crop Yield Tracking Excel Template for Farm Managers
The
Corn Crop Yield Tracking Excel Template for Farm Managers is a practical tool designed to record, analyze, and monitor corn production data efficiently. It helps track variables such as planting date, harvest date, acreage, and yield per acre, enabling precise yield forecasting and resource allocation. This template supports informed decision-making, enhances yield optimization, and simplifies reporting for improved farm management productivity.
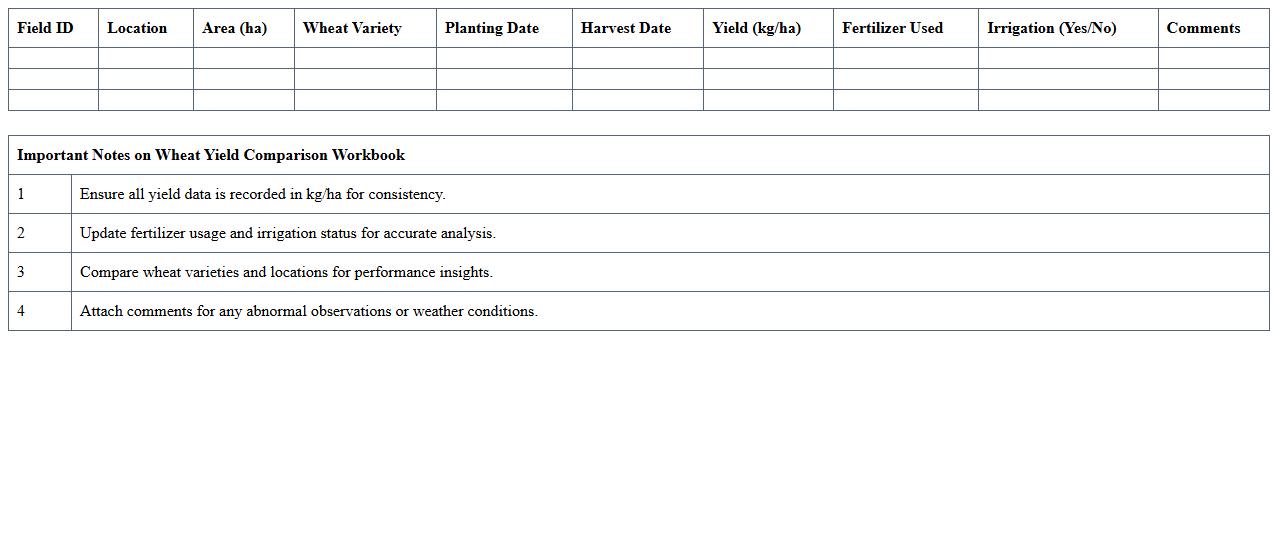
Wheat Yield Comparison Excel Workbook for Agricultural Analysis
The
Wheat Yield Comparison Excel Workbook is a powerful analytical tool designed to compile, compare, and visualize wheat production data across different regions and time periods. It allows farmers, agronomists, and researchers to identify trends, optimize crop management practices, and make data-driven decisions to improve yield efficiency. By streamlining complex data into clear charts and tables, the workbook enhances agricultural planning and resource allocation for better overall productivity.
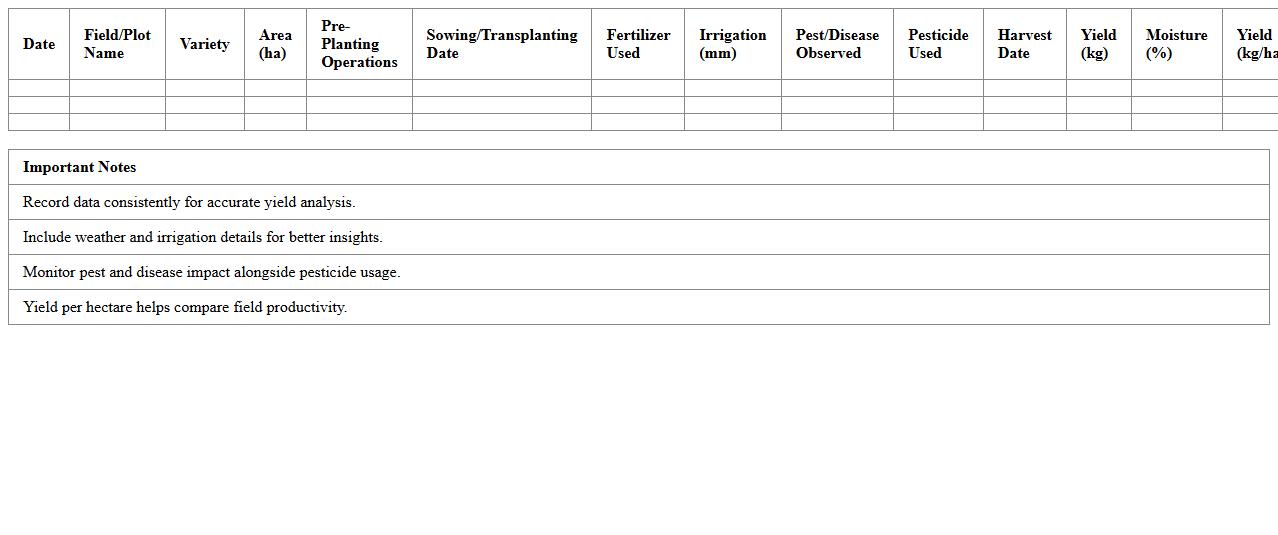
Rice Production Yield Monitoring Excel Sheet for Farm Operations
The
Rice Production Yield Monitoring Excel Sheet for Farm Operations is a comprehensive tool designed to track and analyze rice crop yields efficiently. It helps farmers record data such as planting dates, fertilizer usage, irrigation schedules, and harvest outcomes, enabling precise yield assessment and resource management. This document supports data-driven decision-making, improves productivity, and enhances overall farm operation efficiency by providing actionable insights into rice production trends.
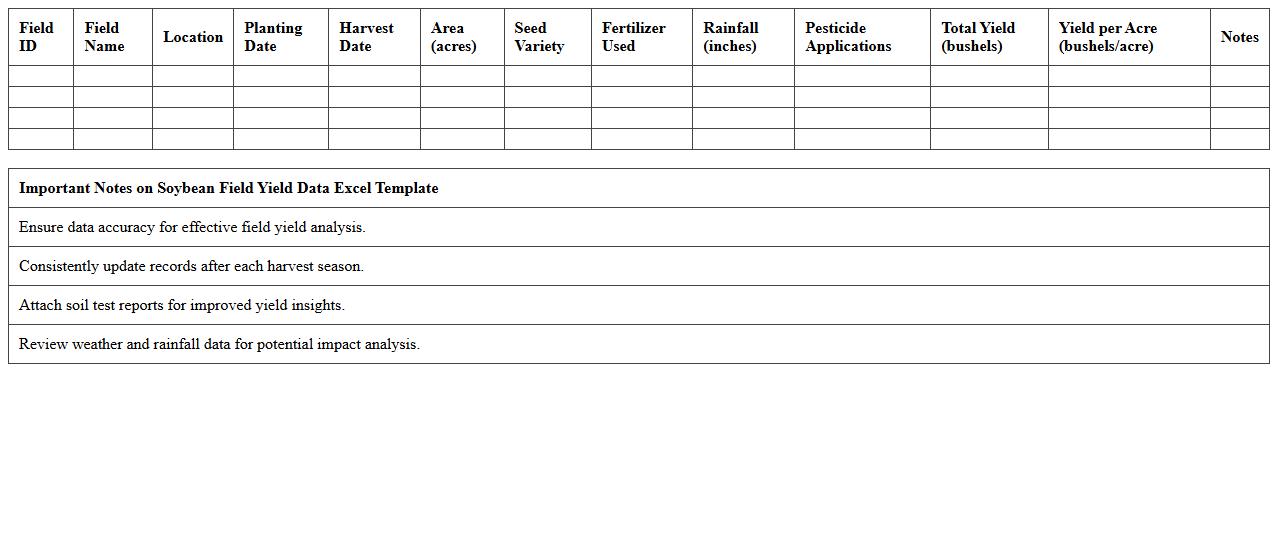
Soybean Field Yield Data Excel Template for Agriculture Management
The
Soybean Field Yield Data Excel Template is a specialized spreadsheet designed to record, analyze, and manage soybean crop yield across different fields efficiently. It helps farmers and agricultural managers track yield variations, identify productive zones, and optimize resource allocation based on data-driven insights. By systematically organizing yield information, this template supports improved decision-making, enhances crop management strategies, and increases overall agricultural productivity.
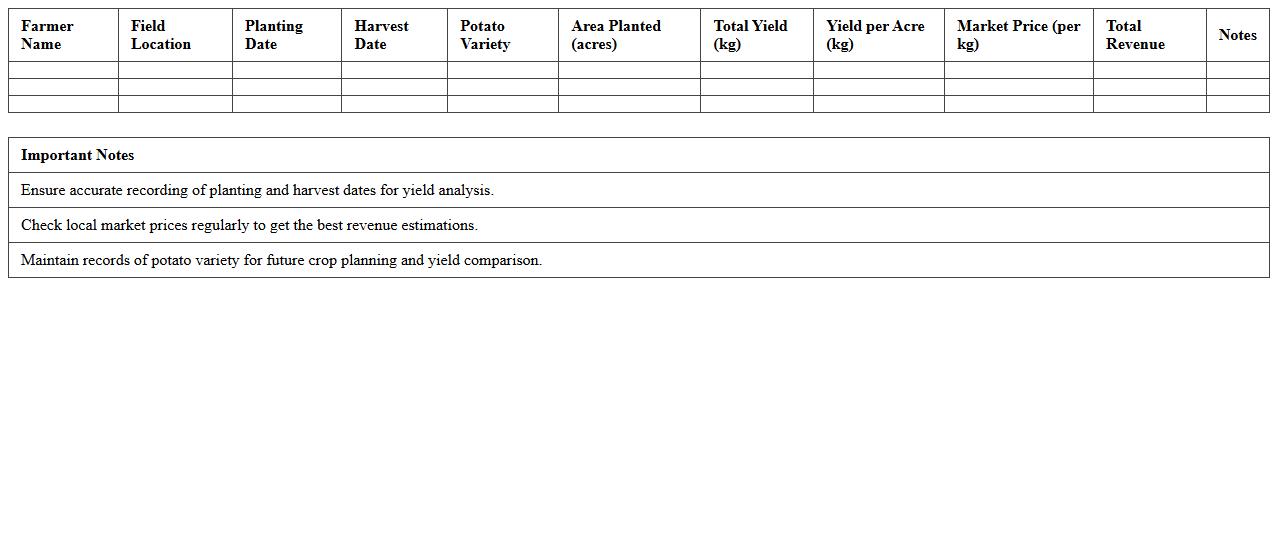
Potato Crop Harvest Yield Report Excel Spreadsheet for Farmers
The
Potato Crop Harvest Yield Report Excel Spreadsheet is a detailed document designed to track and analyze the productivity of potato farms by recording yield data, harvesting dates, and field conditions. This spreadsheet helps farmers optimize their agricultural practices by providing clear insights into the factors affecting crop output, allowing for better planning and resource allocation. By monitoring trends and comparing yields across different seasons or plots, farmers can increase efficiency and maximize their overall harvest profitability.
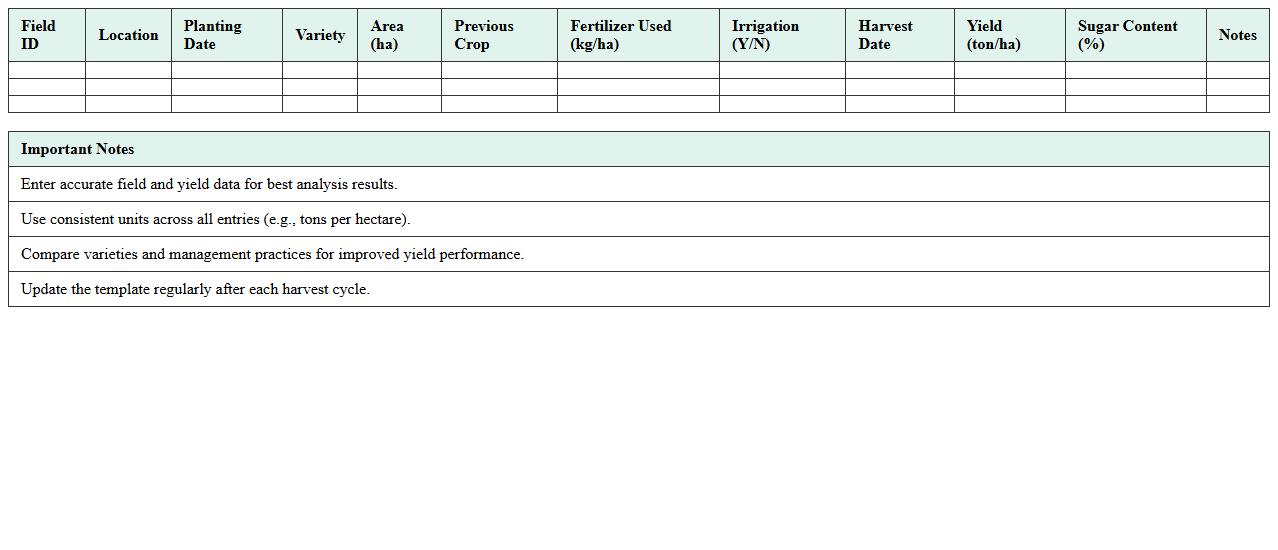
Sugarcane Yield Performance Excel Analysis Template for Farm Managers
The Sugarcane Yield Performance Excel Analysis Template is a
powerful tool designed to help farm managers systematically track and analyze sugarcane crop yields over different periods and plots. This template enables efficient data entry, visualization of yield trends, and identification of factors influencing productivity through automated charts and summaries. Utilizing this analysis enhances decision-making processes, leading to optimized resource allocation and improved overall farm profitability.
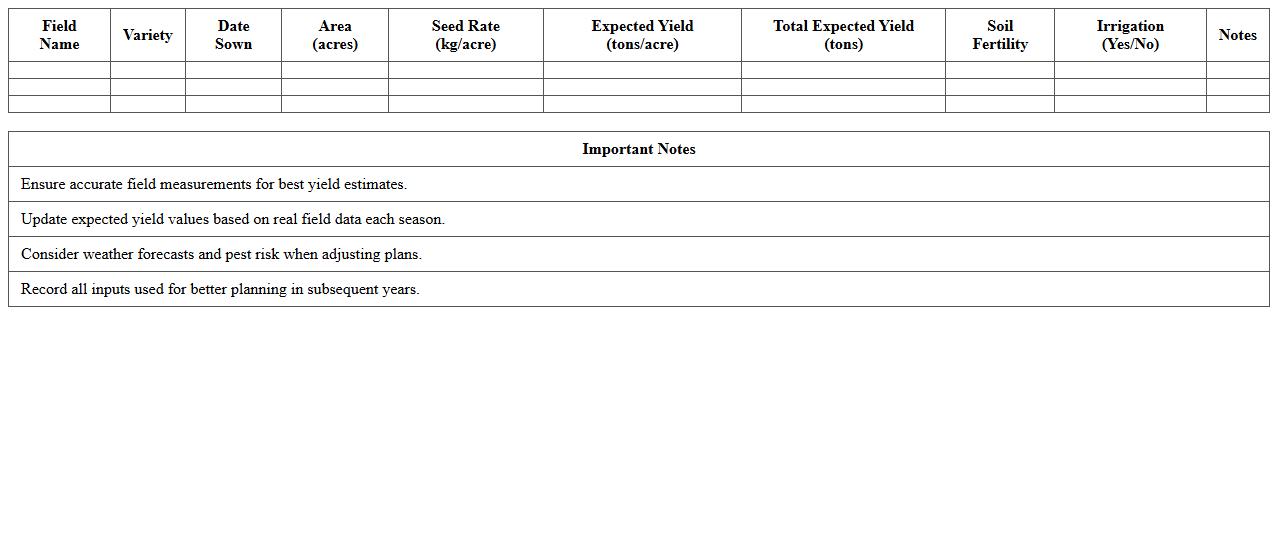
Barley Farm Yield Forecasting Excel Worksheet for Crop Planning
The
Barley Farm Yield Forecasting Excel Worksheet for Crop Planning is a detailed tool designed to predict barley production based on variables such as soil quality, weather patterns, and irrigation schedules. This document assists farmers and agricultural planners in optimizing resource allocation and making informed decisions to maximize crop yield. By analyzing historical data and current conditions, it helps reduce risks and improve the accuracy of harvest forecasts, ultimately enhancing productivity and profitability.
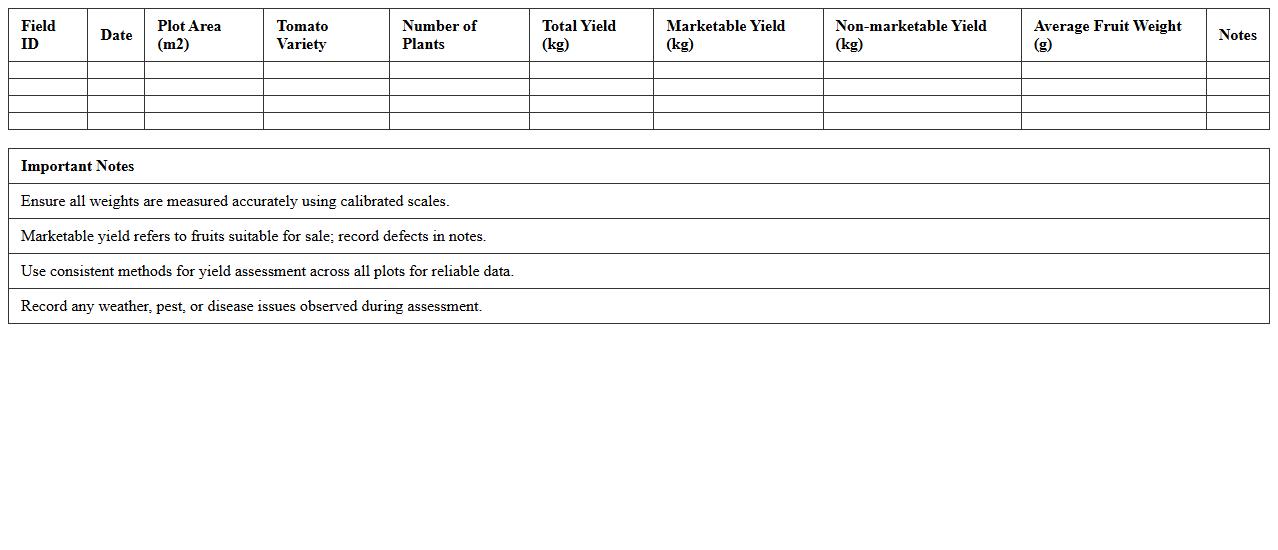
Tomato Yield Assessment Excel Template for Agricultural Productivity
The
Tomato Yield Assessment Excel Template is a comprehensive agricultural tool designed to accurately record and analyze tomato production data, enabling farmers and researchers to track yield trends efficiently. It helps in estimating crop performance by consolidating variables such as planting dates, fertilizer use, irrigation schedules, and harvest quantities into an easy-to-read format. This template enhances decision-making by providing precise insights into productivity factors, ultimately supporting improved crop management and resource allocation for maximizing tomato yield.
Cotton Crop Yield Statistics Excel Tracker for Farm Economics
The
Cotton Crop Yield Statistics Excel Tracker for Farm Economics is a detailed spreadsheet designed to record, analyze, and visualize cotton yield data across different seasons and regions. This tool helps farmers and agronomists monitor trends, optimize resource allocation, and make informed decisions to improve productivity and profitability. By consolidating key metrics such as yield per acre, pest impact, and input costs, it facilitates precise economic assessments and strategic planning for sustainable cotton farming.
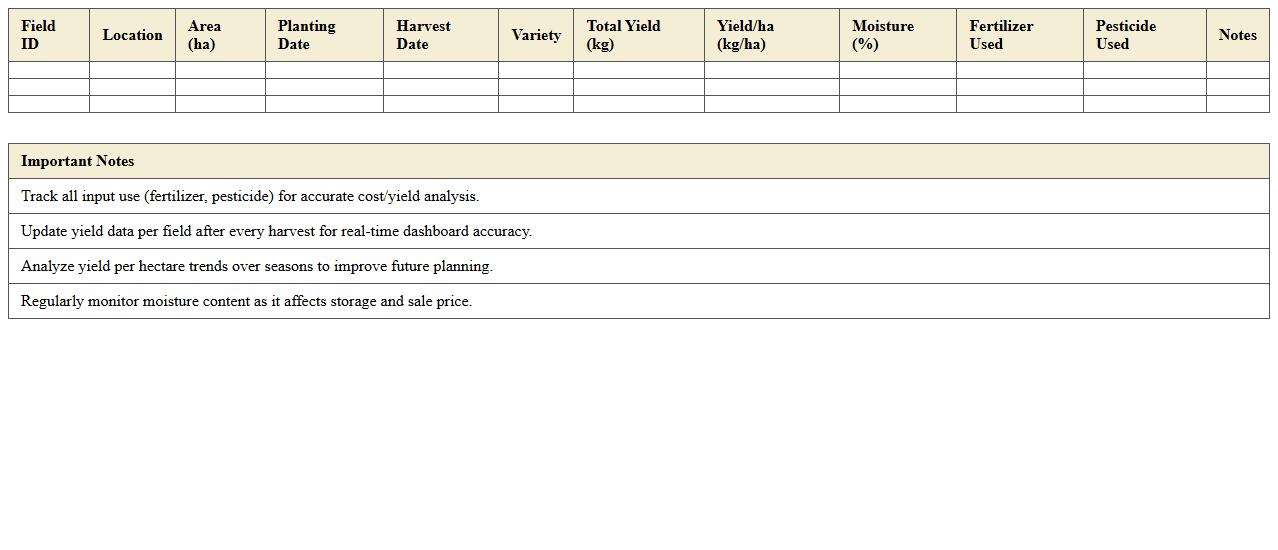
Sunflower Yield Analysis Excel Dashboard for Farm Managers
The
Sunflower Yield Analysis Excel Dashboard for Farm Managers is a comprehensive tool designed to track, analyze, and visualize sunflower crop yields efficiently. It consolidates data such as planting dates, weather conditions, soil quality, and harvest results to provide actionable insights for improving farm productivity. This dashboard helps farm managers make data-driven decisions to optimize resource allocation, detect yield trends, and maximize overall profitability.
How can I automate rainfall data input in my crop yield analysis Excel template?
To automate rainfall data input, connect Excel to online weather data sources using Power Query or APIs. Using VBA macros can help import and update rainfall data automatically without manual entry. This ensures your crop yield template always has the latest and most accurate rainfall information for precise analysis.
What are the best Excel formulas for calculating multi-year yield trends?
Use the TREND function to calculate linear growth trends in crop yields over multiple years. The AVERAGEIFS function helps analyze yields conditioned on year ranges and other factors. Combining these with SUMPRODUCT or array formulas can refine your understanding of long-term yield patterns efficiently.
How do I customize pivot tables for variety-based crop yield comparisons?
Create a pivot table with crop variety as rows and yield data as values to compare performance effectively. Customize by applying filters for years or locations, and use the "Value Field Settings" to calculate averages or totals per variety. Adding slicers improves interactivity, letting stakeholders explore variety-specific yield insights instantly.
Which Excel charts best visualize seasonal crop performance for stakeholders?
Line and column charts are ideal for illustrating seasonal yield trends and variations over time. Combining these with stacked area charts can emphasize contributions from different crop varieties throughout the season. Utilize dynamic chart ranges linked to pivot tables to keep stakeholder visuals updated with the latest data.
How can conditional formatting highlight yield anomalies by field in my spreadsheet?
Apply conditional formatting rules such as data bars, color scales, or icon sets to quickly identify abnormal yield values per field. Use formula-based rules to flag values outside expected ranges, highlighting fields with unusually high or low yields. This visual cue enables fast detection and decision-making to address potential issues.